See Everything. From Services to AI Agents.
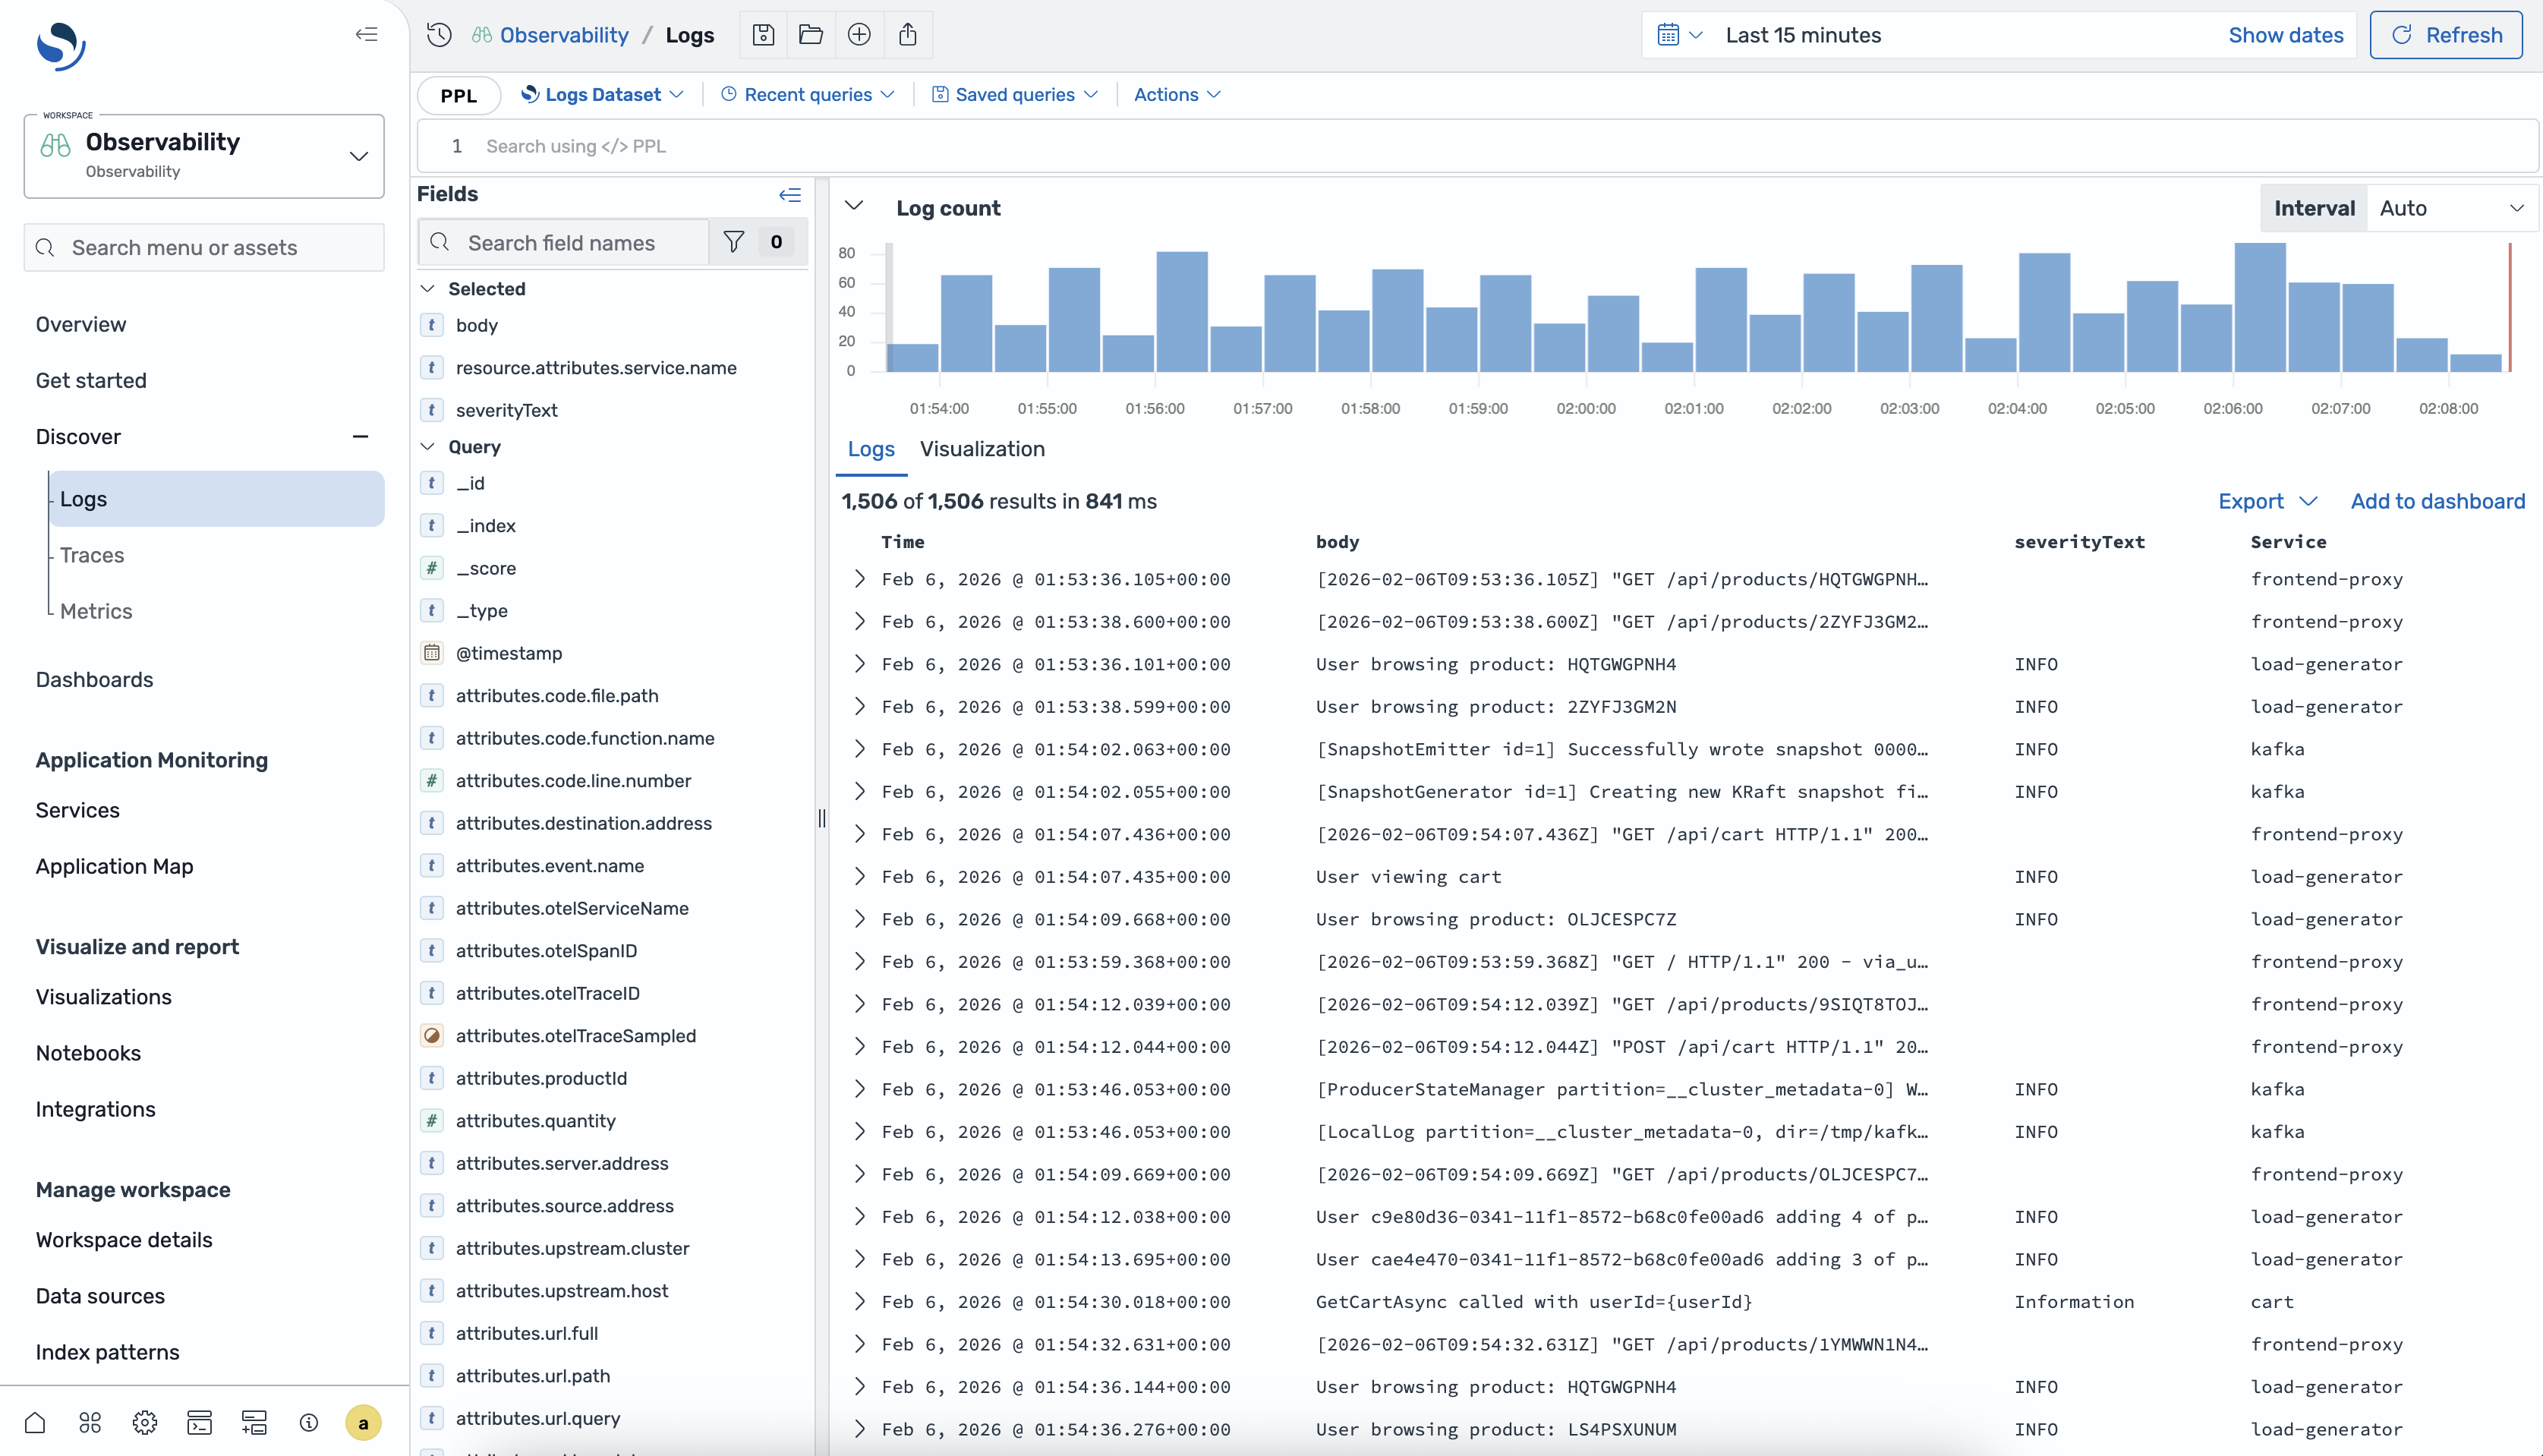
Traces. Logs. Metrics. Dashboards. Service maps. AI agent tracing. Built-in ML. PPL query language. One open-source platform for full-stack observability. No license fees. No lock-in.
OpenTelemetry-native. Apache 2.0. Self-host anywhere. Zero lock-in.
Traces
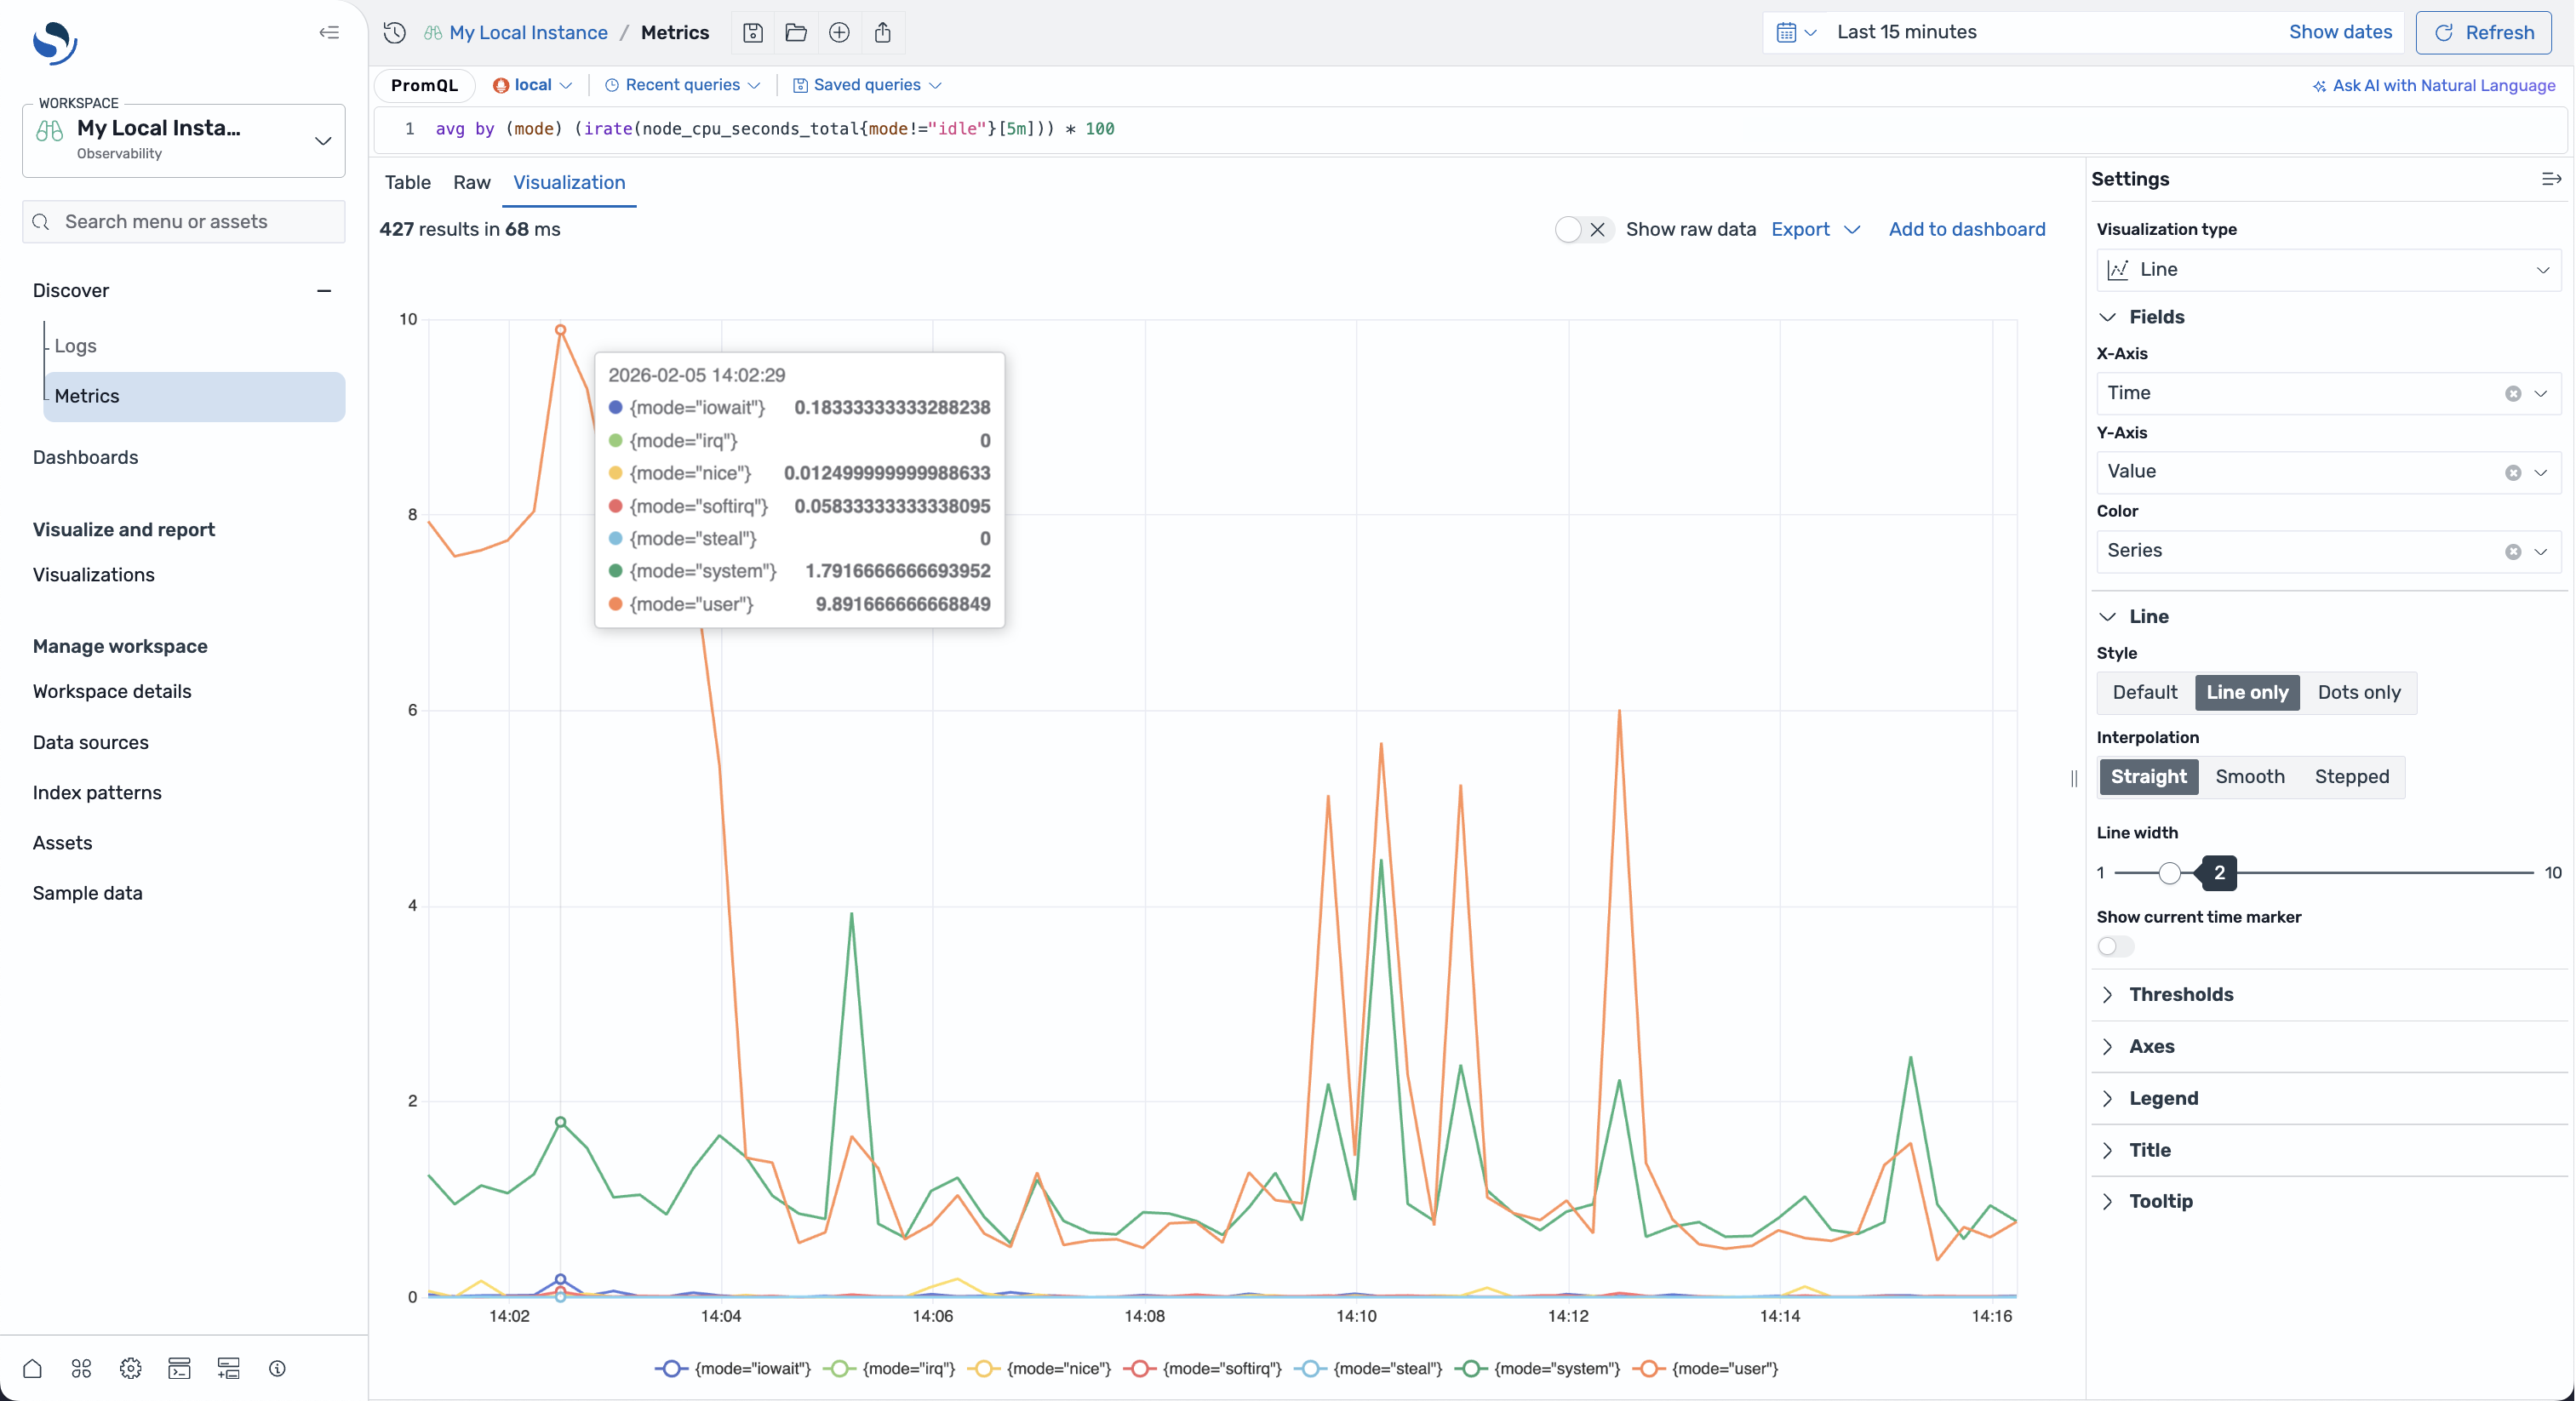
Metrics
↻
Dashboards
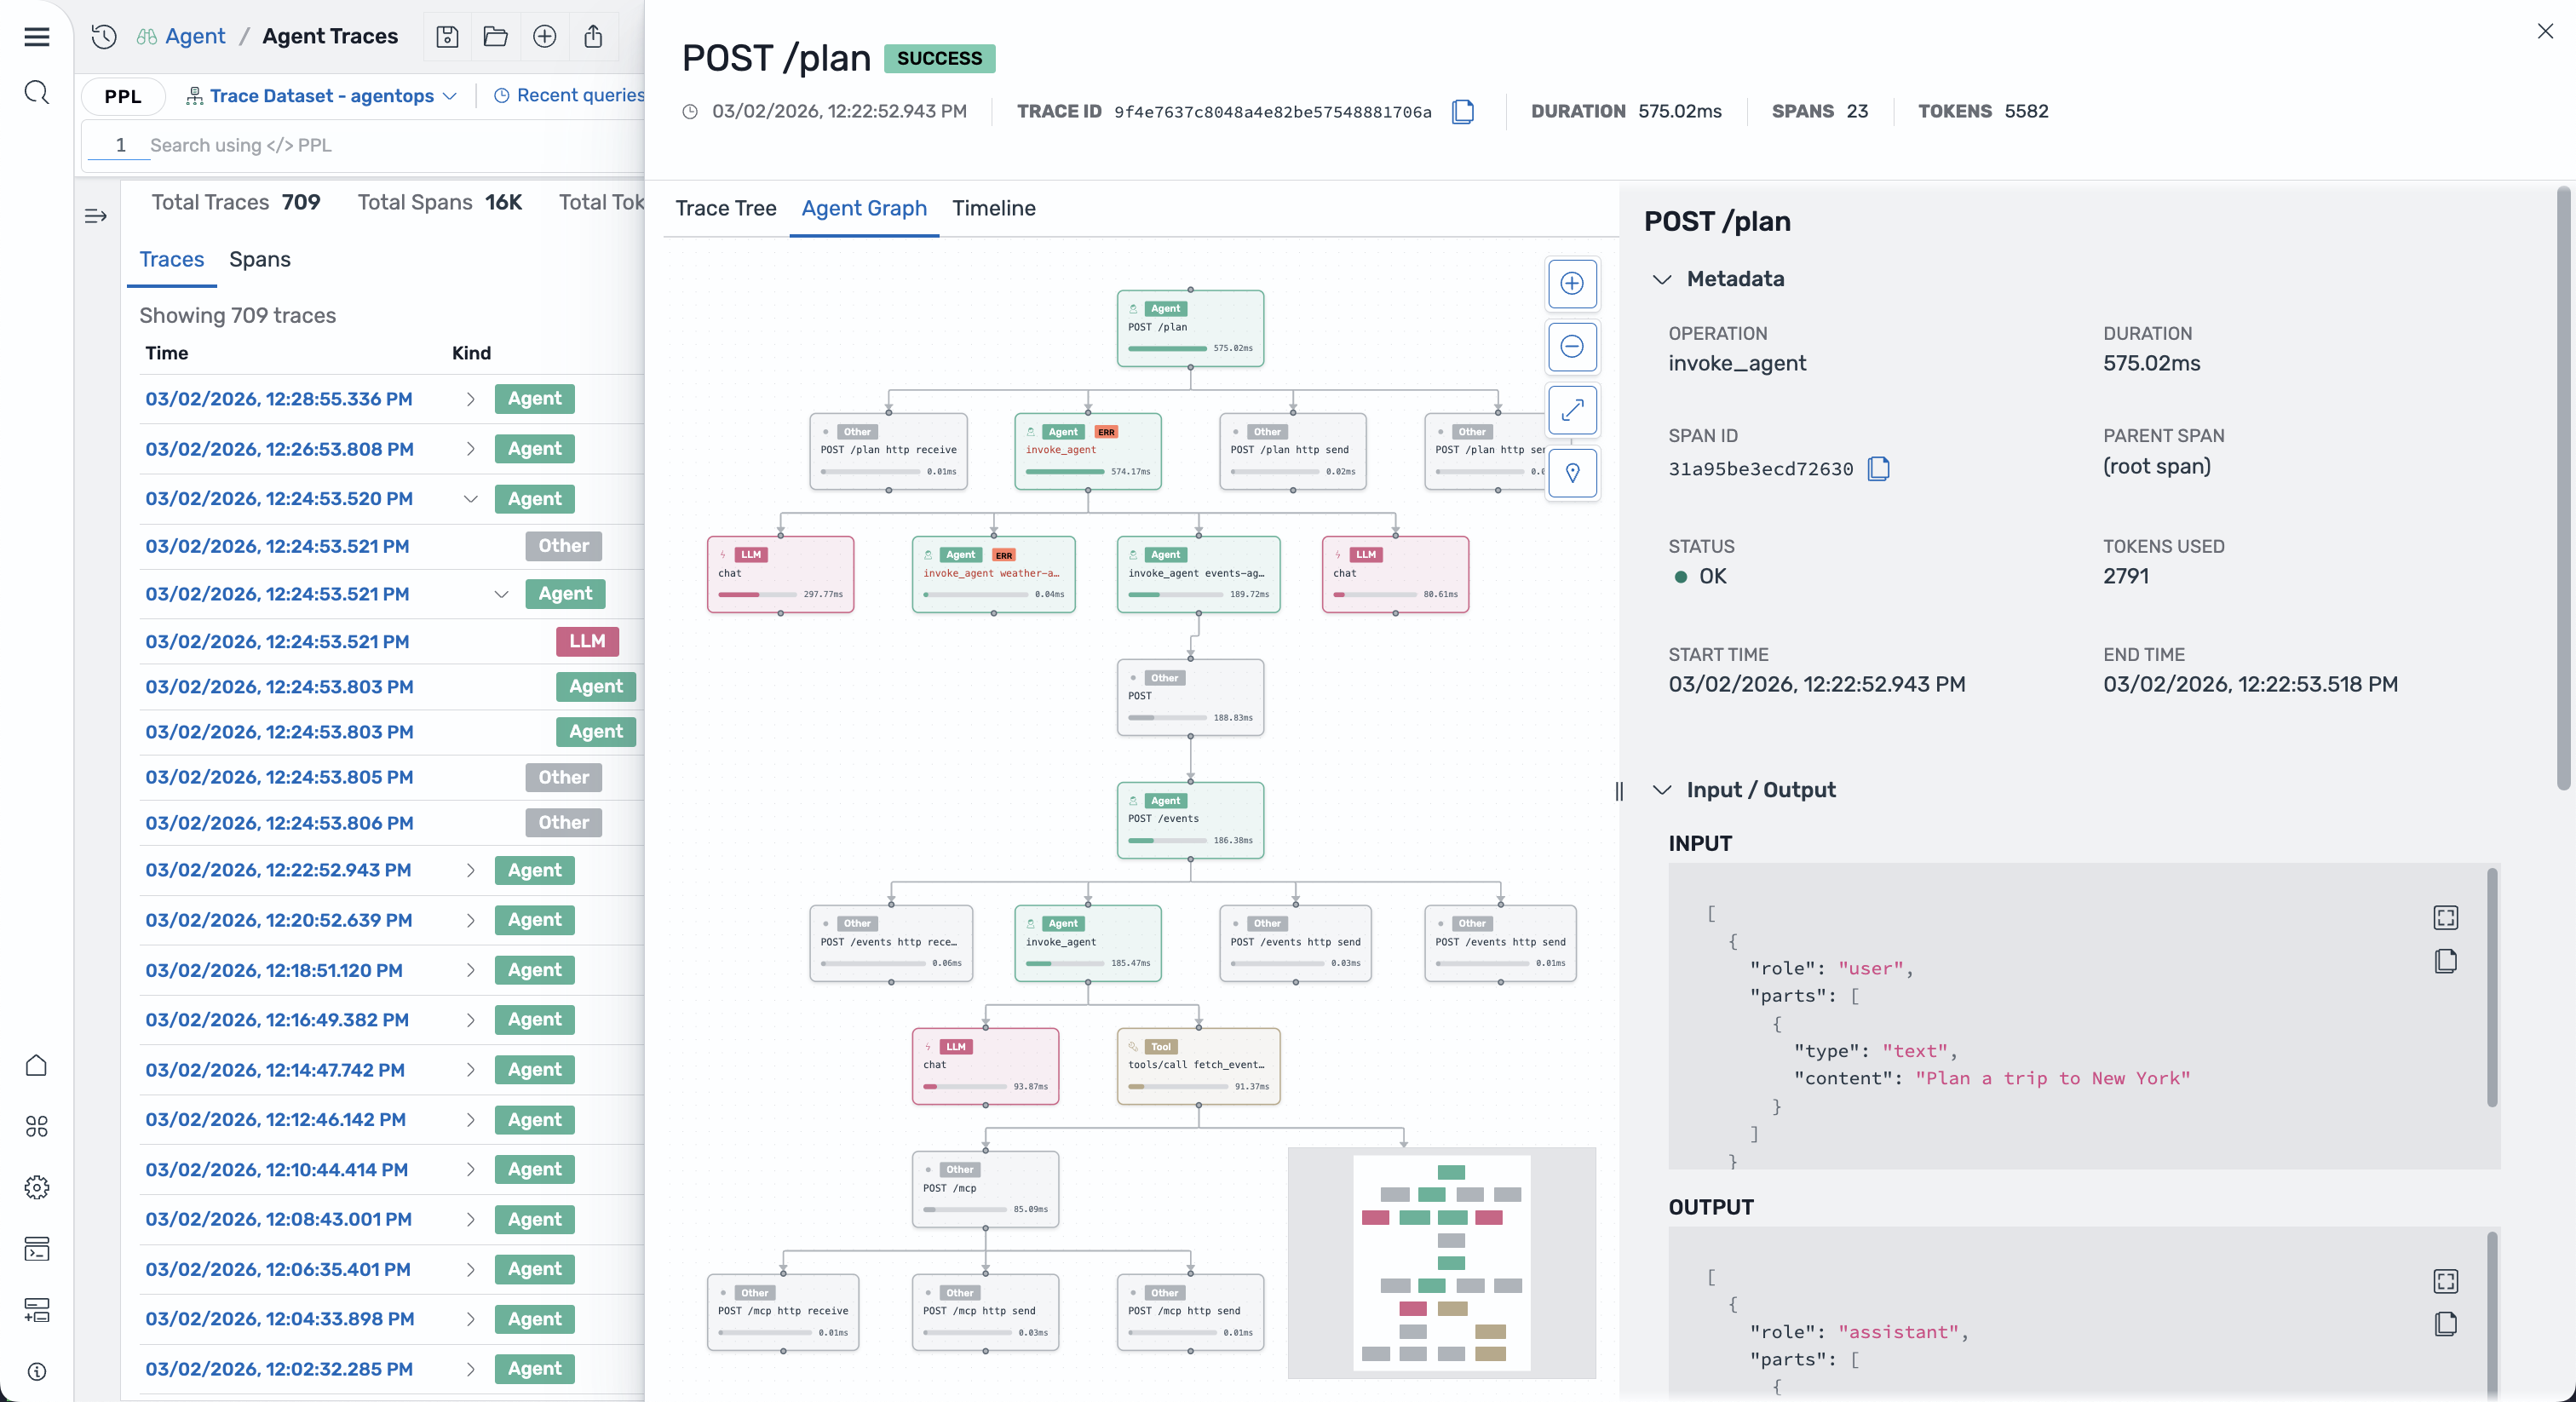
AI Agents
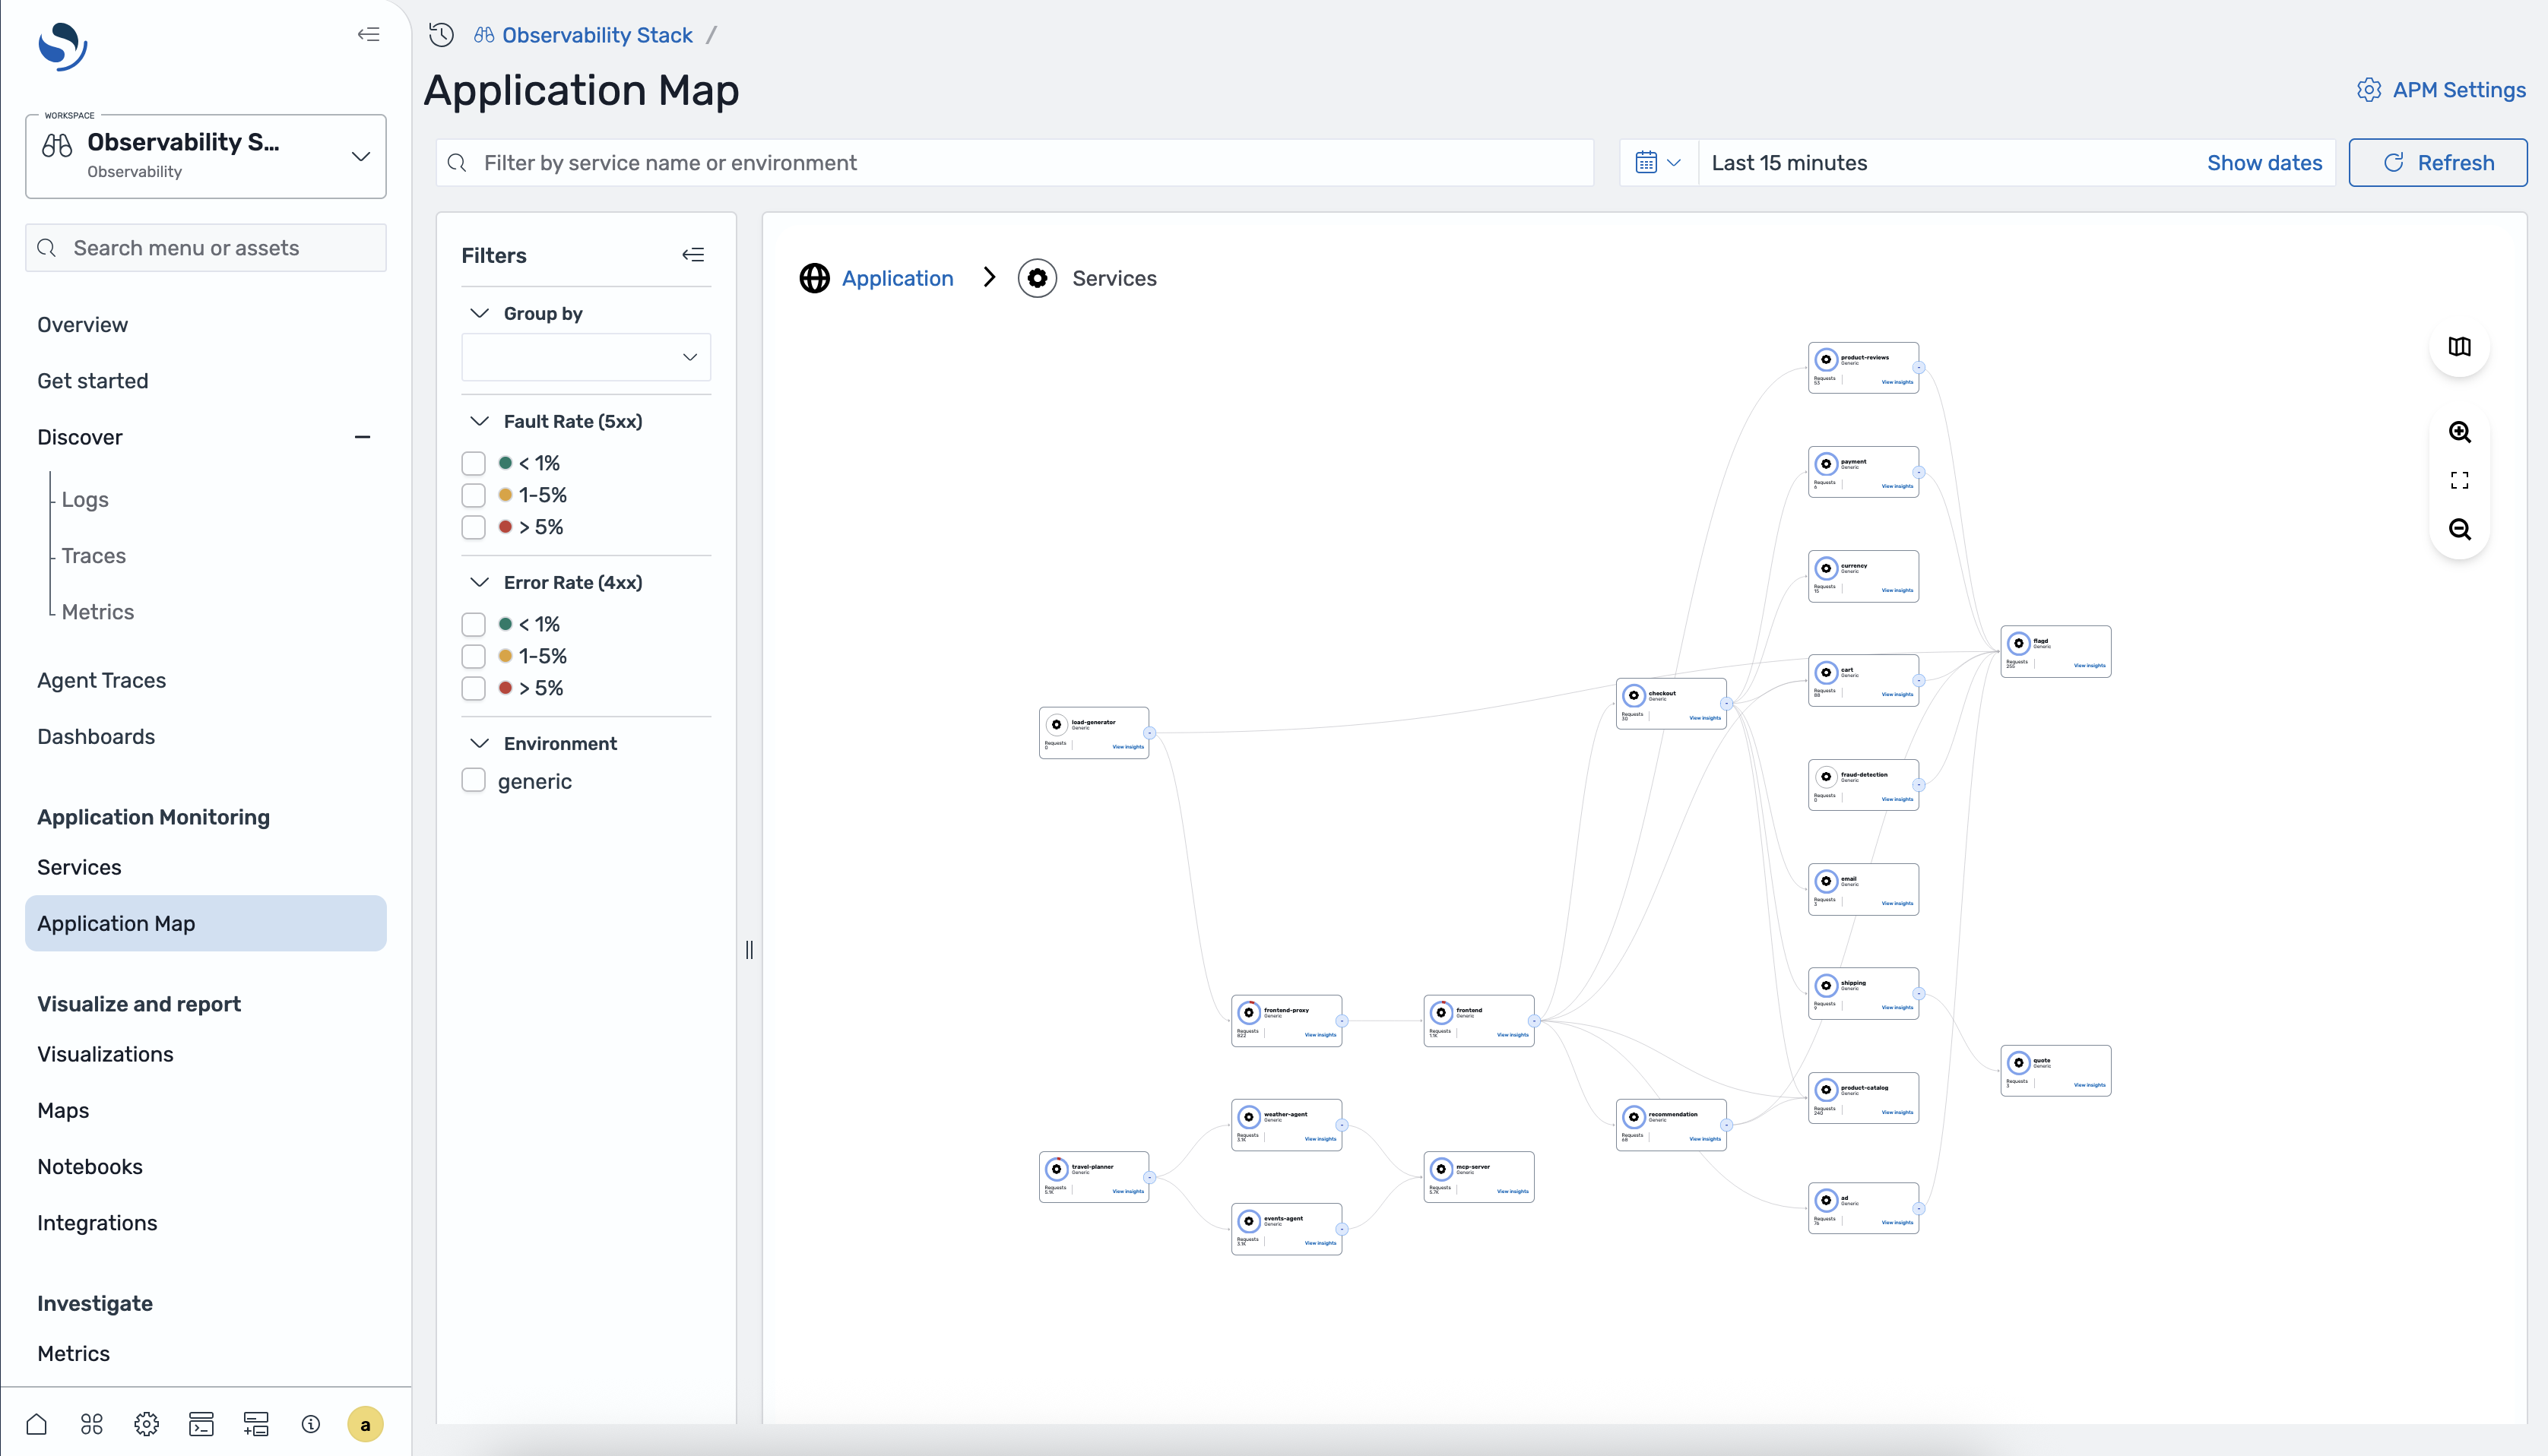
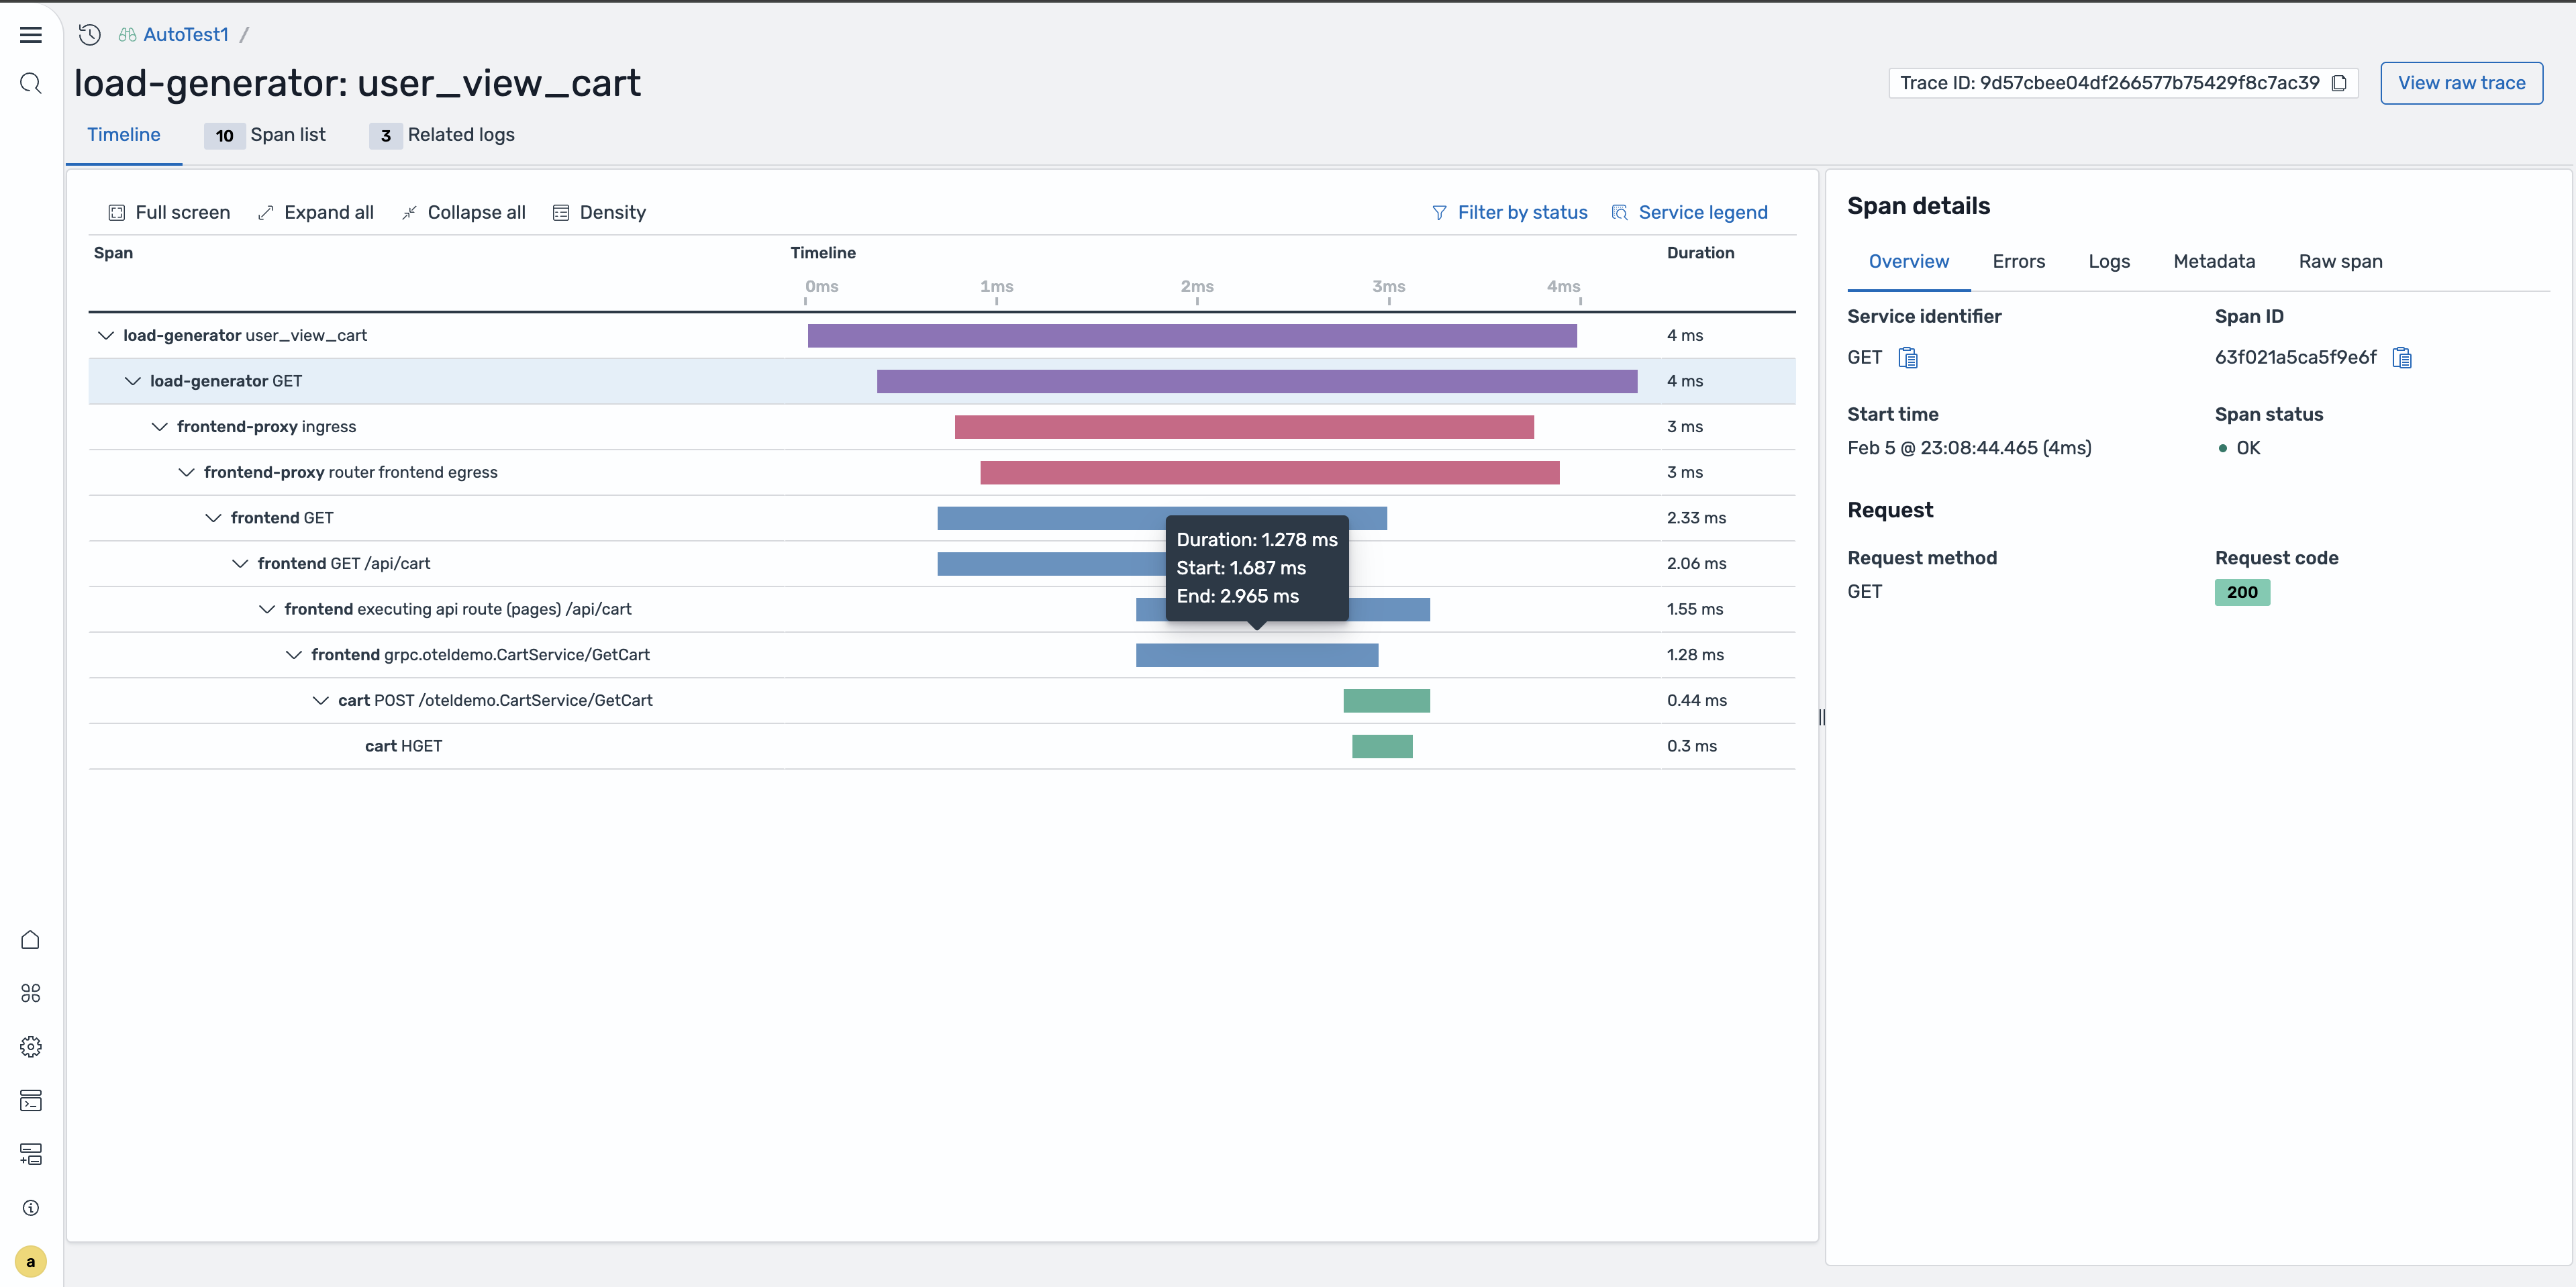
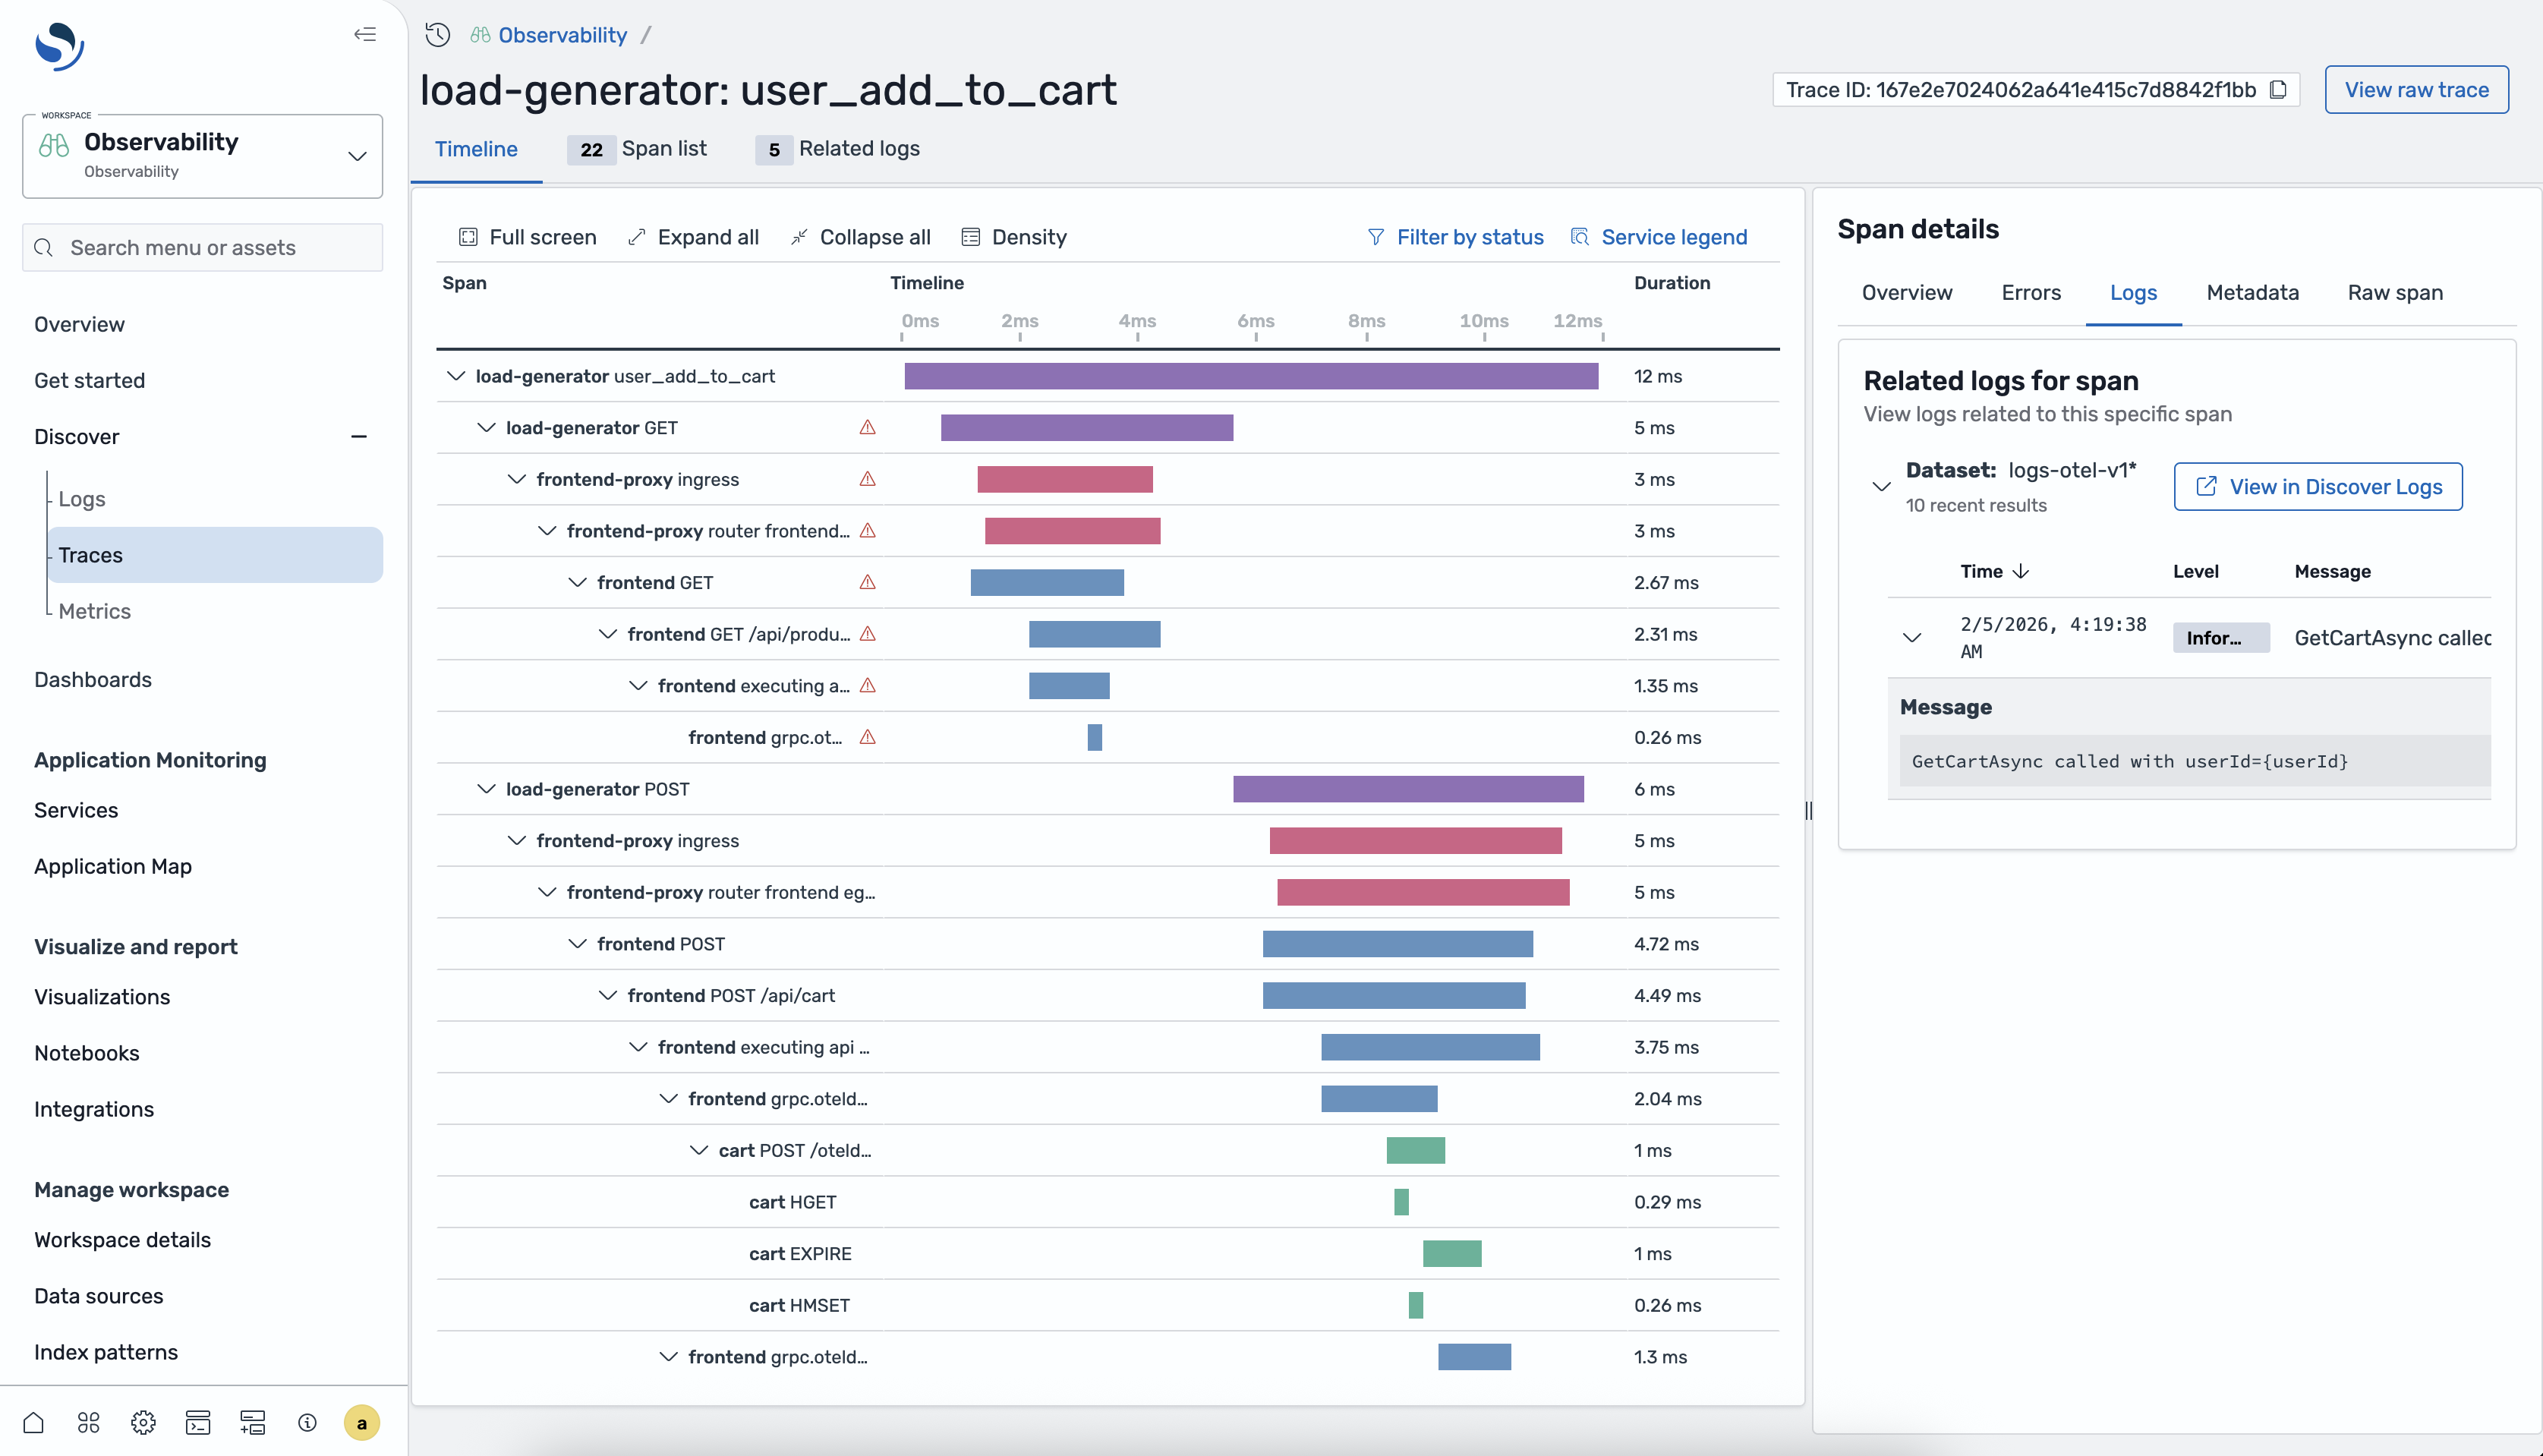
Traces
Distributed tracing with auto-generated service maps and RED metrics
Quick Start
$ curl -fsSL https://raw.githubusercontent.com/opensearch-project/observability-stack/main/install.sh | bash
Docker, Kubernetes, or bare metal. Full stack in 5 minutes.