Agent Traces
The Agent Traces plugin for OpenSearch Dashboards provides a purpose-built interface for exploring, debugging, and monitoring LLM agent execution traces. It gives developers and platform operators full observability into agentic AI applications, including hierarchical trace views, detail flyouts, flow visualizations, and aggregate metrics.
Agent trace data is ingested through OpenTelemetry (OTel) using the GenAI semantic conventions and stored natively in OpenSearch indices.
Architecture
Section titled “Architecture”The following diagram shows the data flow from instrumented applications to the Agent Traces UI:
LLM Application (with OTel SDK + GenAI instrumentation) │ │ OTLP (gRPC/HTTP) ▼OTel Collector (batch, transform) │ ├──── OTLP ────► Data Prepper ──► OpenSearch (otel-v1-apm-span-*) │ └──── Prometheus Remote Write ──► Prometheus (metrics) │ ▼ OpenSearch Dashboards └── Agent Traces PluginKey architectural principles:
- OTel GenAI conventions as the canonical schema: Spans are indexed as-is with
gen_ai.*attributes. No custom schema translation is needed. - OpenSearch as the sole data store: All trace data lives in OpenSearch indices. No external databases are required.
- PPL for querying: Trace browsing, filtering, and aggregation use OpenSearch PPL (Piped Processing Language).
- On-demand tree loading: The initial table shows root spans. Full trace trees are fetched lazily when you expand or view a trace’s details.
Prerequisites
Section titled “Prerequisites”Before using Agent Traces, ensure that you have the following:
- An OpenSearch cluster with trace data indexed in
otel-v1-apm-span-*indices. - OpenTelemetry instrumentation with GenAI semantic conventions enabled in your LLM application.
- Data Prepper configured with the
otel_trace_rawprocessor to ingest spans into OpenSearch. - PPL query support enabled in OpenSearch Dashboards.
Required span attributes
Section titled “Required span attributes”Trace data must include the following core fields:
| Field | Type | Description |
|---|---|---|
traceId | keyword | Unique trace identifier |
spanId | keyword | Unique span identifier |
parentSpanId | keyword | Parent span ID (empty for root spans) |
startTime | date_nanos | Span start timestamp |
endTime | date_nanos | Span end timestamp |
durationInNanos | long | Span duration in nanoseconds |
status.code | keyword | Status code (0 = OK, 1 = UNSET, 2 = ERROR) |
For AI agent observability, spans should also include gen_ai.* attributes:
| Field | Type | Description |
|---|---|---|
attributes.gen_ai.operation.name | keyword | Span type (chat, execute_tool, invoke_agent, embeddings) |
attributes.gen_ai.request.model | keyword | Requested LLM model |
attributes.gen_ai.provider.name | keyword | LLM provider (openai, aws.bedrock, anthropic) |
attributes.gen_ai.usage.input_tokens | long | Input token count |
attributes.gen_ai.usage.output_tokens | long | Output token count |
attributes.gen_ai.input.messages | object | Input payload (prompts, messages) |
attributes.gen_ai.output.messages | object | Output payload (completions, responses) |
attributes.gen_ai.tool.name | keyword | Tool identifier |
attributes.gen_ai.conversation.id | keyword | Session or conversation grouping |
attributes.gen_ai.agent.name | keyword | Human-readable agent name |
Page layout
Section titled “Page layout”The Agent Traces page is organized into the following areas:
- Top navigation bar: Contains options to save, load, share, and create new queries.
- Query panel: An editor for writing and executing PPL queries, with dataset selection and language toggle.
- Results area: A resizable layout containing a fields selector on the left and trace results on the right.
Metrics bar
Section titled “Metrics bar”At the top of the results area, a metrics bar displays aggregate statistics for the current query:
- Total Traces: The number of root traces returned.
- Total Spans: The total number of spans across all traces.
- Total Tokens: Aggregated token usage (input + output).
- Latency P50: The 50th percentile latency.
- Latency P99: The 99th percentile latency.
Traces tab
Section titled “Traces tab”The Traces tab displays root-level agent traces in a paginated table, as shown in the following image. Root traces are spans with no parent (parentSpanId is empty) that have a gen_ai.operation.name attribute.
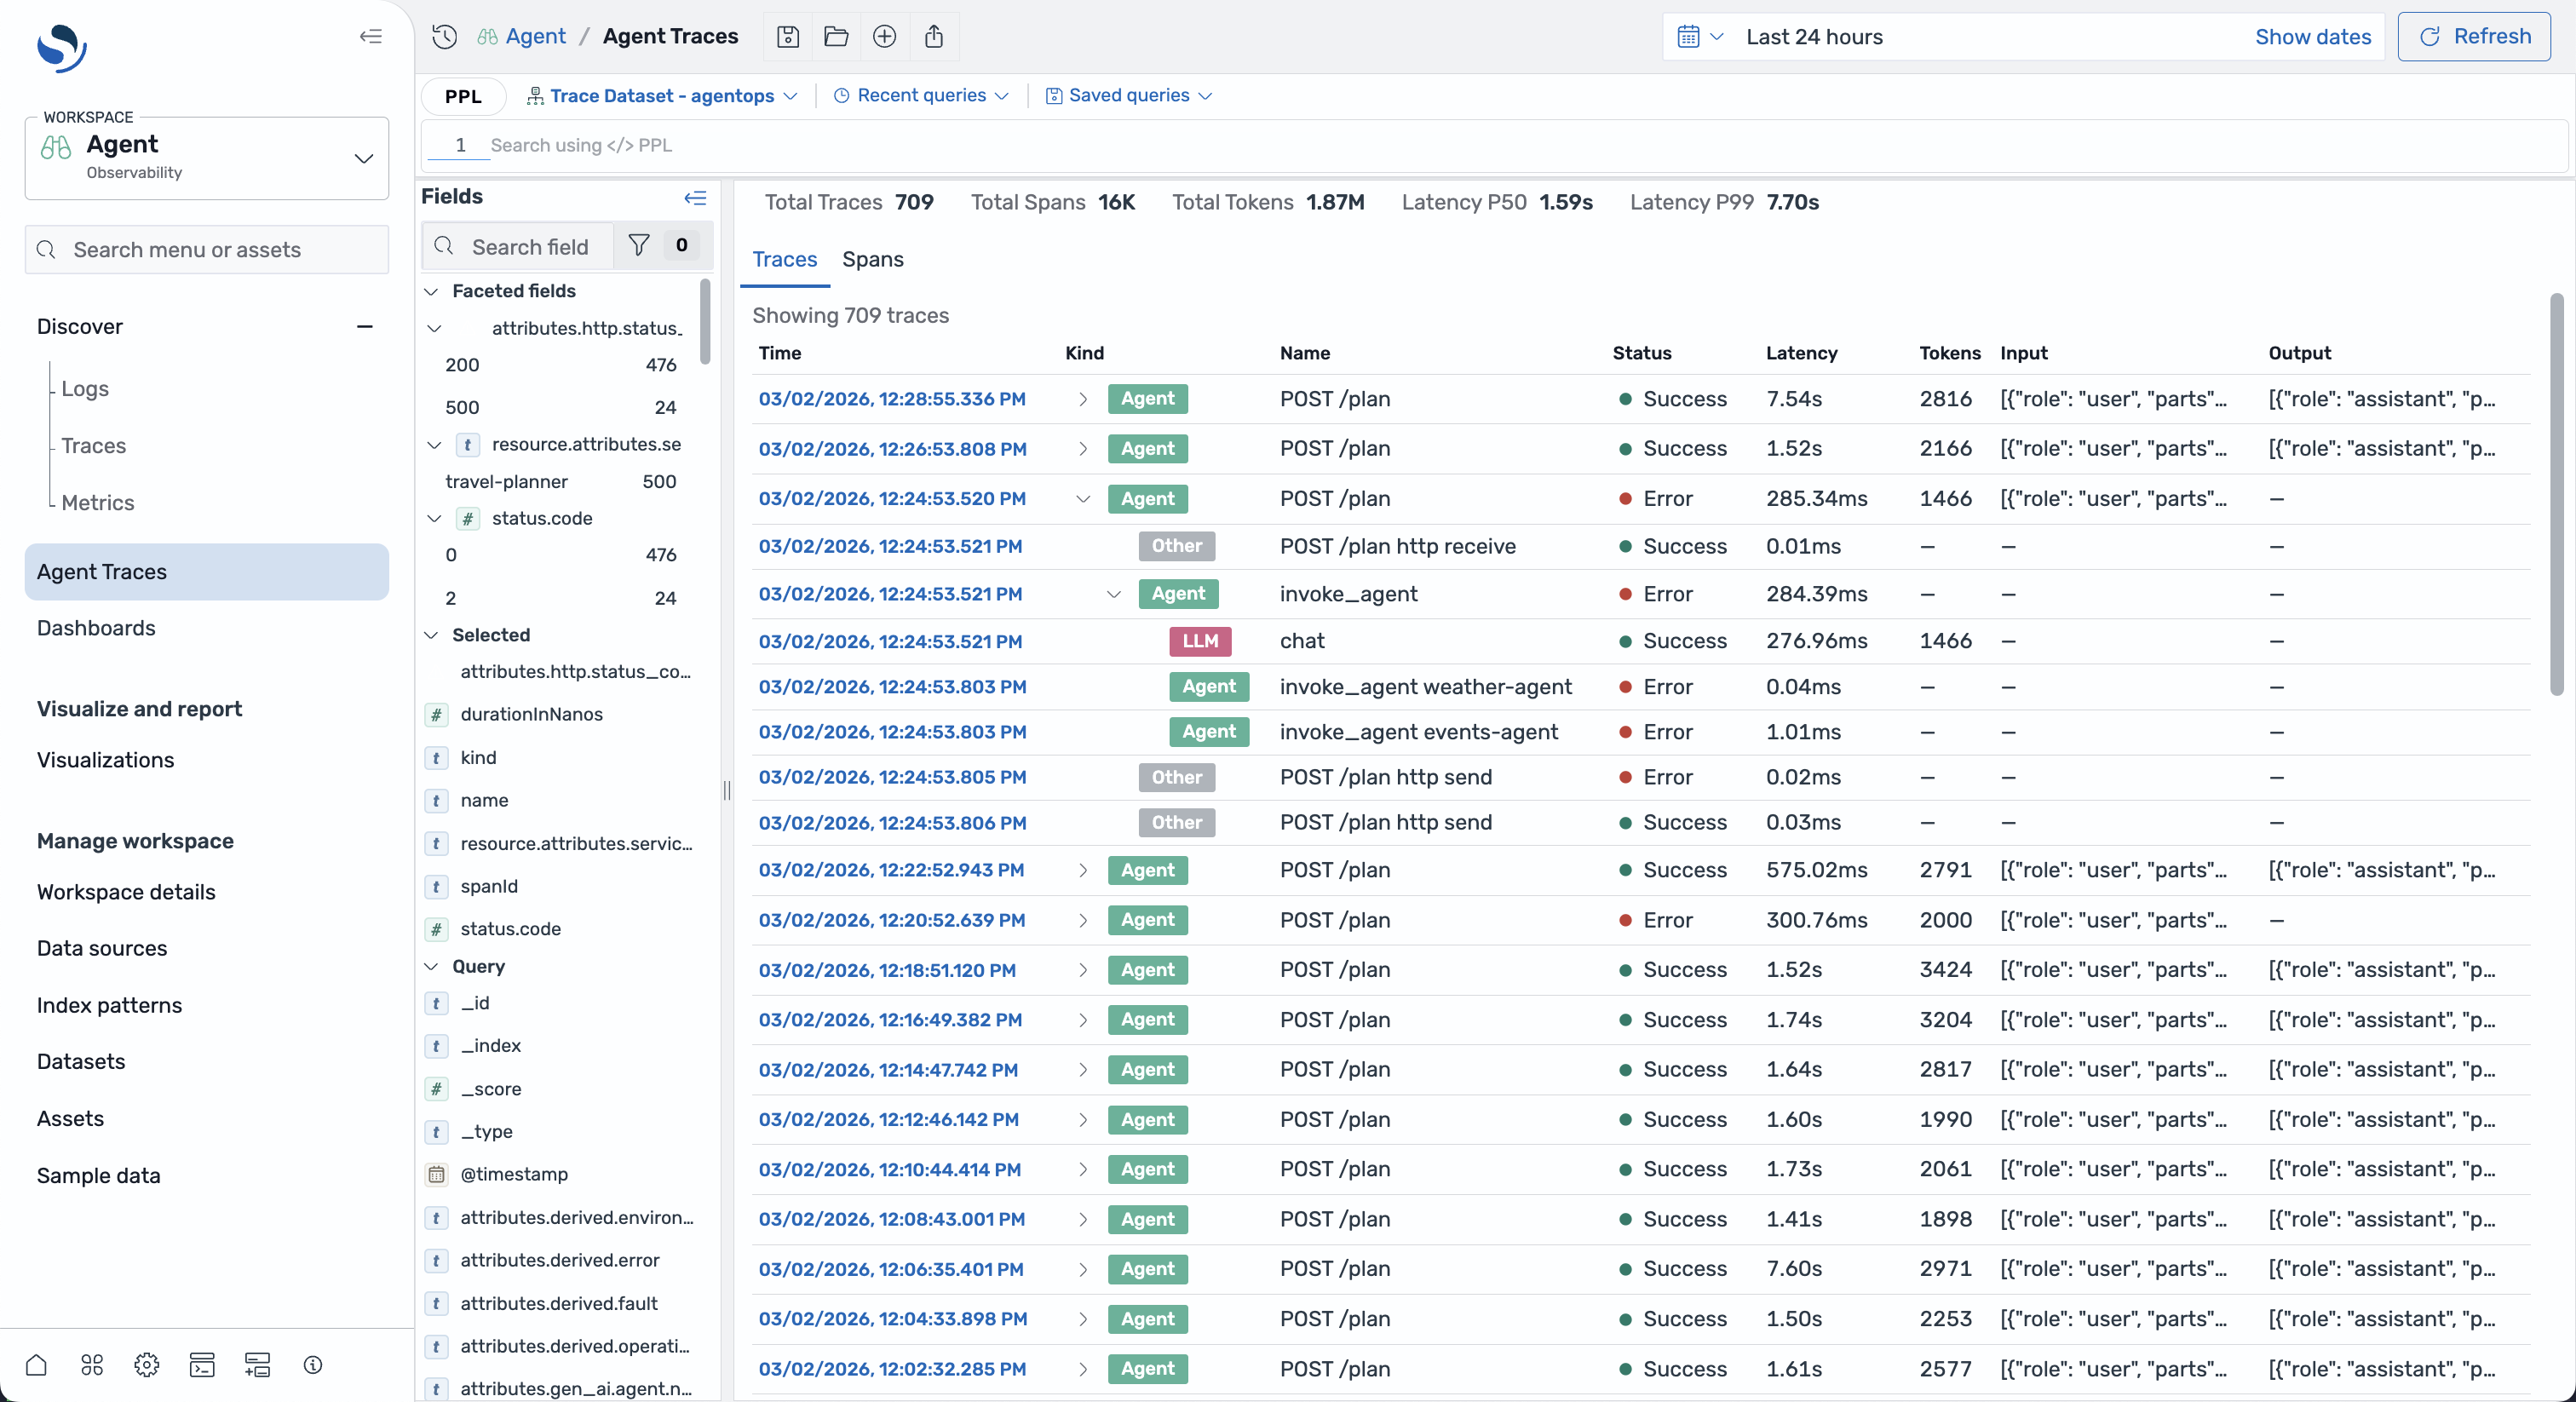
The table includes the following columns:
| Column | Description |
|---|---|
| Time | Clickable timestamp of the span start time |
| Kind | Color-coded badge showing the span category (Agent, LLM, Tool, and others) |
| Name | The span operation name |
| Status | Success or error indicator |
| Latency | Duration of the span |
| Tokens | Total tokens used |
| Input | Truncated user input or prompt |
| Output | Truncated LLM response |
Expanding traces
Section titled “Expanding traces”Select the expand arrow on a trace row to load and display its child spans inline. The full trace tree is fetched on demand and cached for subsequent views. Child spans are displayed with indentation to show the hierarchical parent-child relationship.
Span categories
Section titled “Span categories”Spans are categorized based on the gen_ai.operation.name attribute:
| Operation name | Category | Description |
|---|---|---|
invoke_agent, create_agent | Agent | Agent orchestration step |
chat | LLM | LLM chat completion call |
text_completion, generate_content | Content | Text generation operation |
execute_tool | Tool | Tool invocation |
embeddings | Embeddings | Embedding generation |
retrieval | Retrieval | Data retrieval operation |
Each category is displayed with a unique color and icon in the UI.
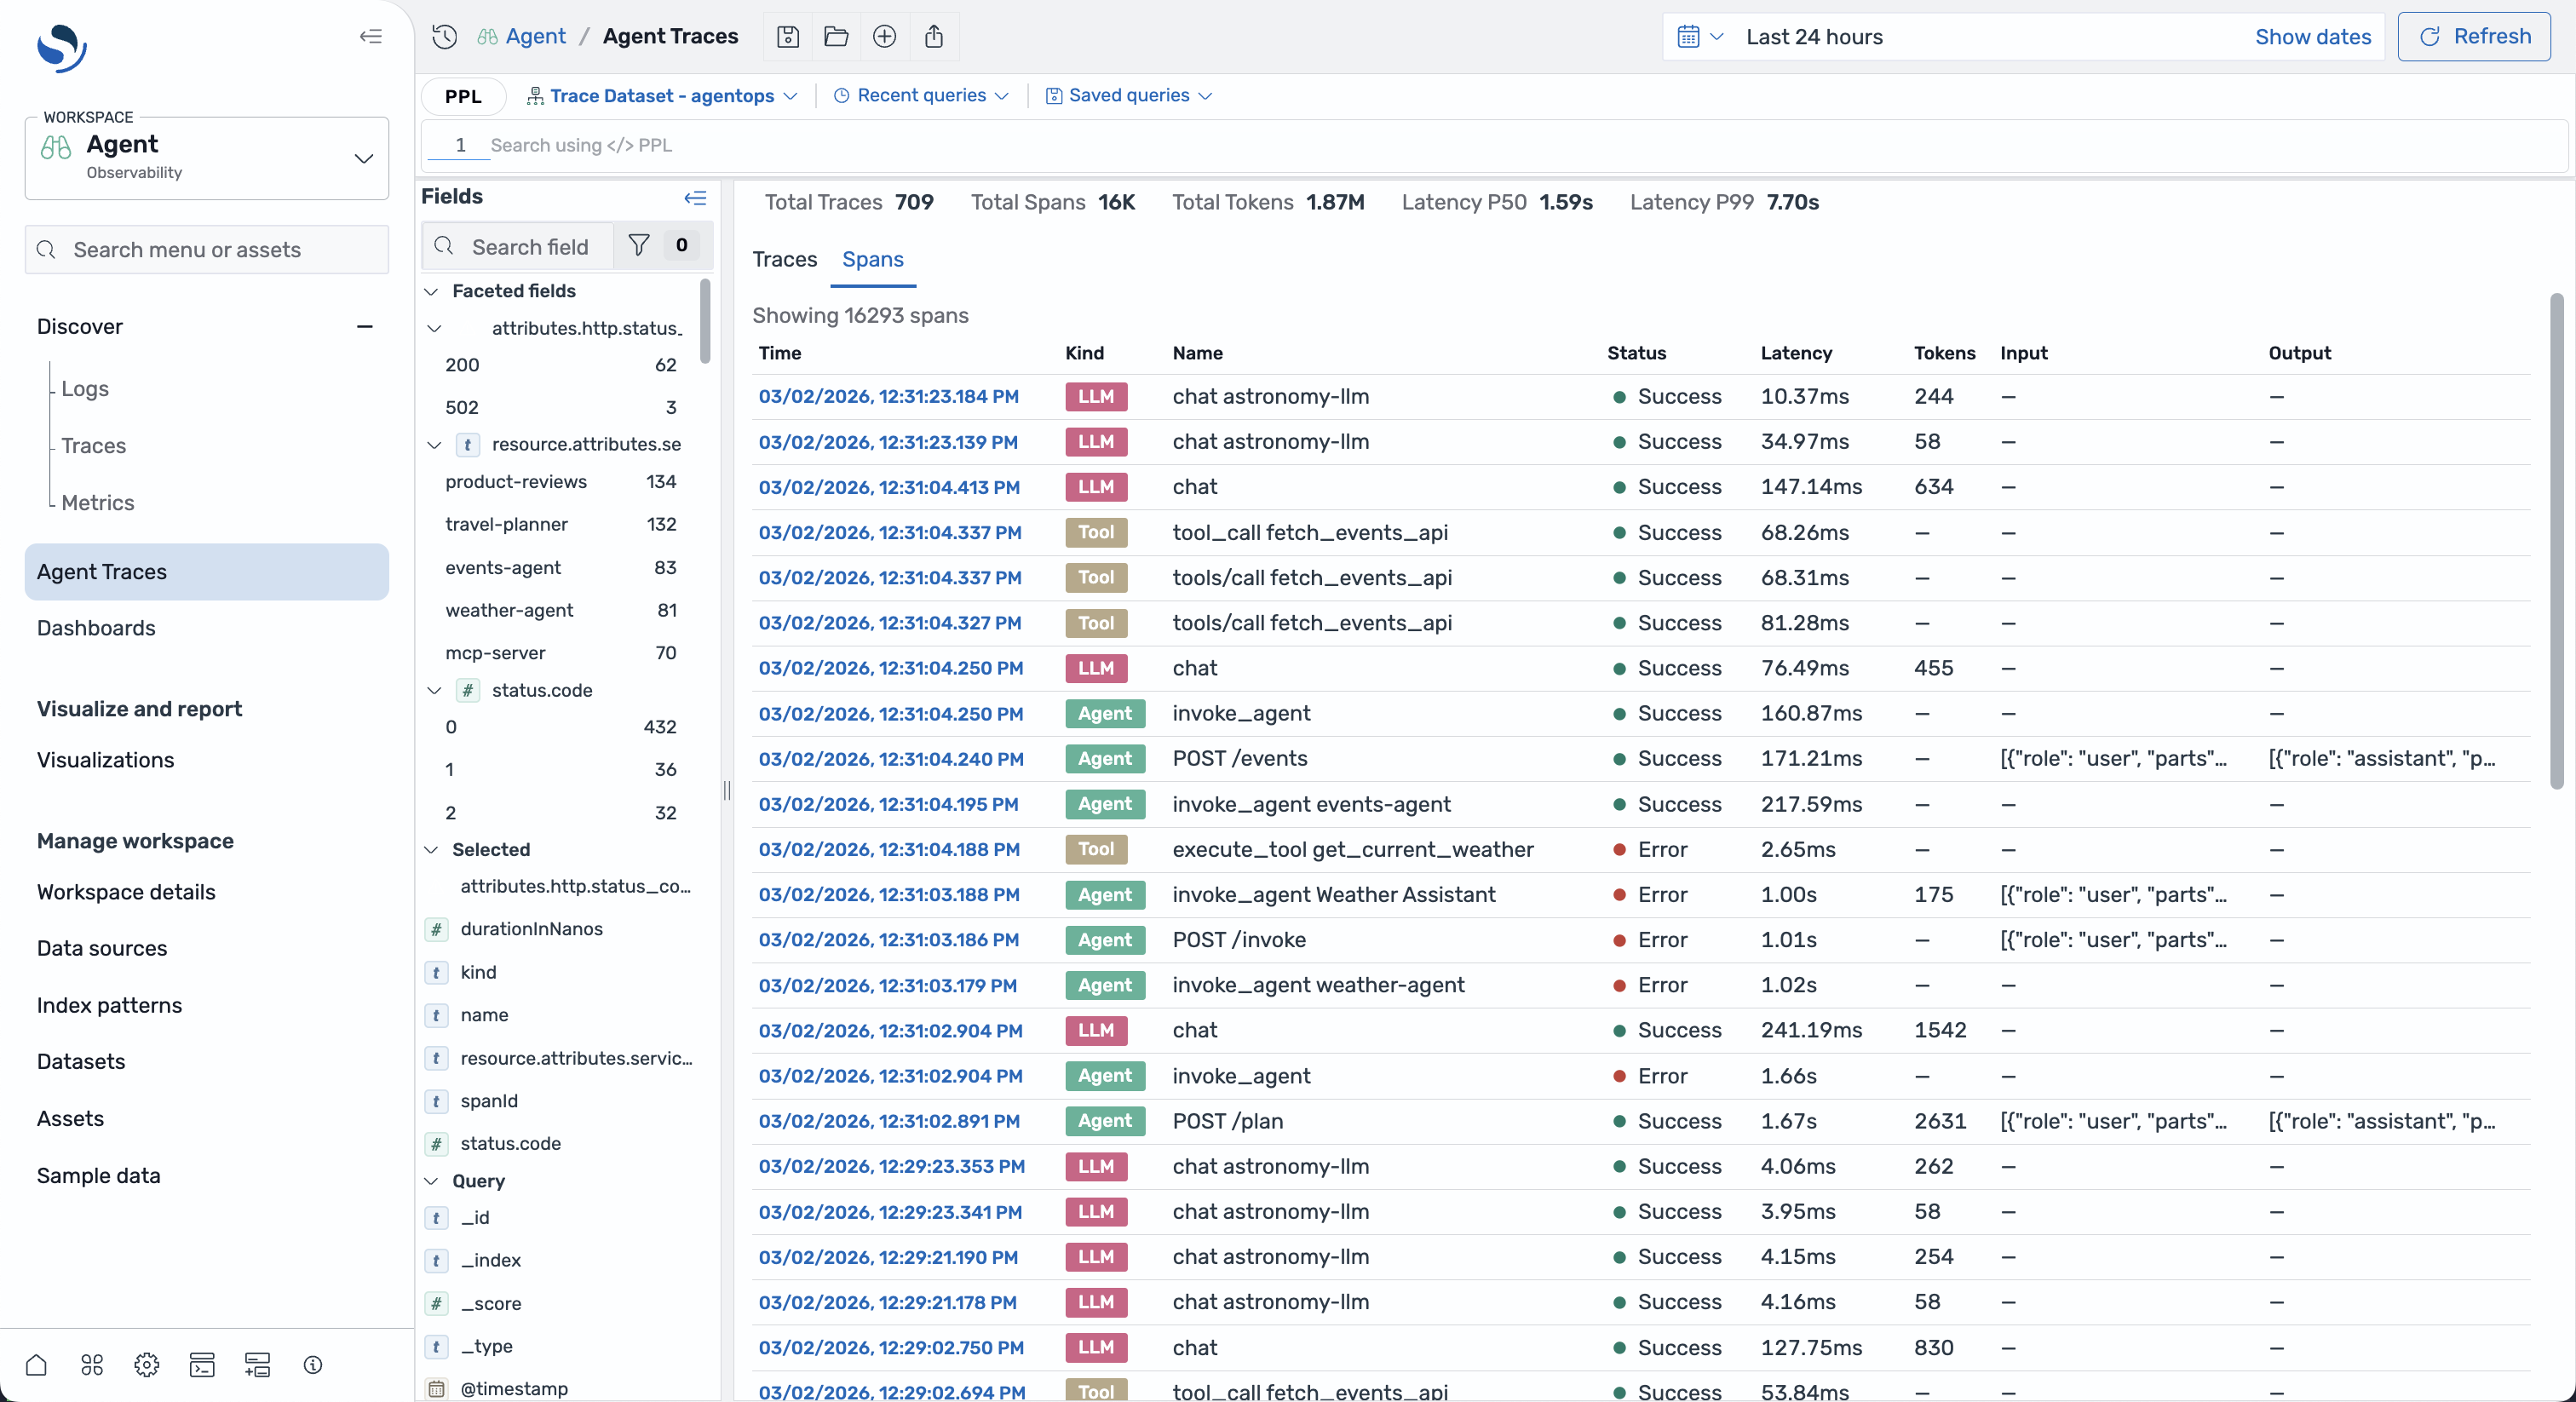
Spans tab
Section titled “Spans tab”The Spans tab shows all gen_ai spans (not only root traces) in a paginated table, as shown in the following image. This view is useful for examining individual operations across multiple traces. The table structure is similar to the Traces tab.
Trace details flyout
Section titled “Trace details flyout”Selecting a trace row opens a resizable flyout panel on the right side of the screen. The flyout header displays the trace name, status badge, start time, trace ID (with a copy button), duration, span count, and token count.
The flyout is divided into two resizable panels:
Left panel
Section titled “Left panel”The left panel provides two views for navigating the trace hierarchy:
-
Trace tree: A hierarchical tree view of all spans in the trace. Each node shows the span name, category badge, and status indicator. You can expand and collapse nodes to explore the hierarchy and select a node to view its details.
-
Flow: A directed acyclic graph (DAG) visualization built with React Flow. Nodes are color-coded by category and connected by edges showing execution dependencies. The view includes a minimap for navigation. Selecting a node synchronizes with the detail panel.
Right panel
Section titled “Right panel”The right panel shows details for the selected span:
-
Detail tab: Displays the raw span attributes as a JSON code block along with formatted metadata including timing, token usage, and status information.
-
Timeline tab: A Gantt-style timeline showing all spans arranged chronologically. Bar widths are proportional to span duration and color-coded by category. You can select a span in the timeline to synchronize with the tree view.
Querying traces
Section titled “Querying traces”Agent Traces uses PPL (Piped Processing Language) for all data fetching. You can write queries in the query panel at the top of the page.
Listing root traces
Section titled “Listing root traces”To list root agent traces:
source = otel-v1-apm-span-*| where parentSpanId = "" AND isnotnull(`attributes.gen_ai.operation.name`)| sort - startTime| head 100Fetching all spans for a trace
Section titled “Fetching all spans for a trace”To fetch the complete span tree for a specific trace:
source = otel-v1-apm-span-*| where traceId = "<trace-id>"| head 1000Computing aggregate metrics
Section titled “Computing aggregate metrics”To compute aggregate statistics across traces:
source = otel-v1-apm-span-*| where parentSpanId = "" AND isnotnull(`attributes.gen_ai.operation.name`)| stats count() as total_traces, percentile(durationInNanos, 50) as p50_latency, percentile(durationInNanos, 99) as p99_latency, sum(`attributes.gen_ai.usage.input_tokens`) as input_tokens, sum(`attributes.gen_ai.usage.output_tokens`) as output_tokens