Agent Graph & Path
The Agent Traces plugin provides three synchronized views for visualizing the execution path of an AI agent trace: an Agent Graph, a Trace tree, and a Timeline. These views appear in the trace details flyout when you select a trace row on the Agent Traces page.
All three views share the same selection state. Selecting a span in one view highlights it in the other views.
Agent graph
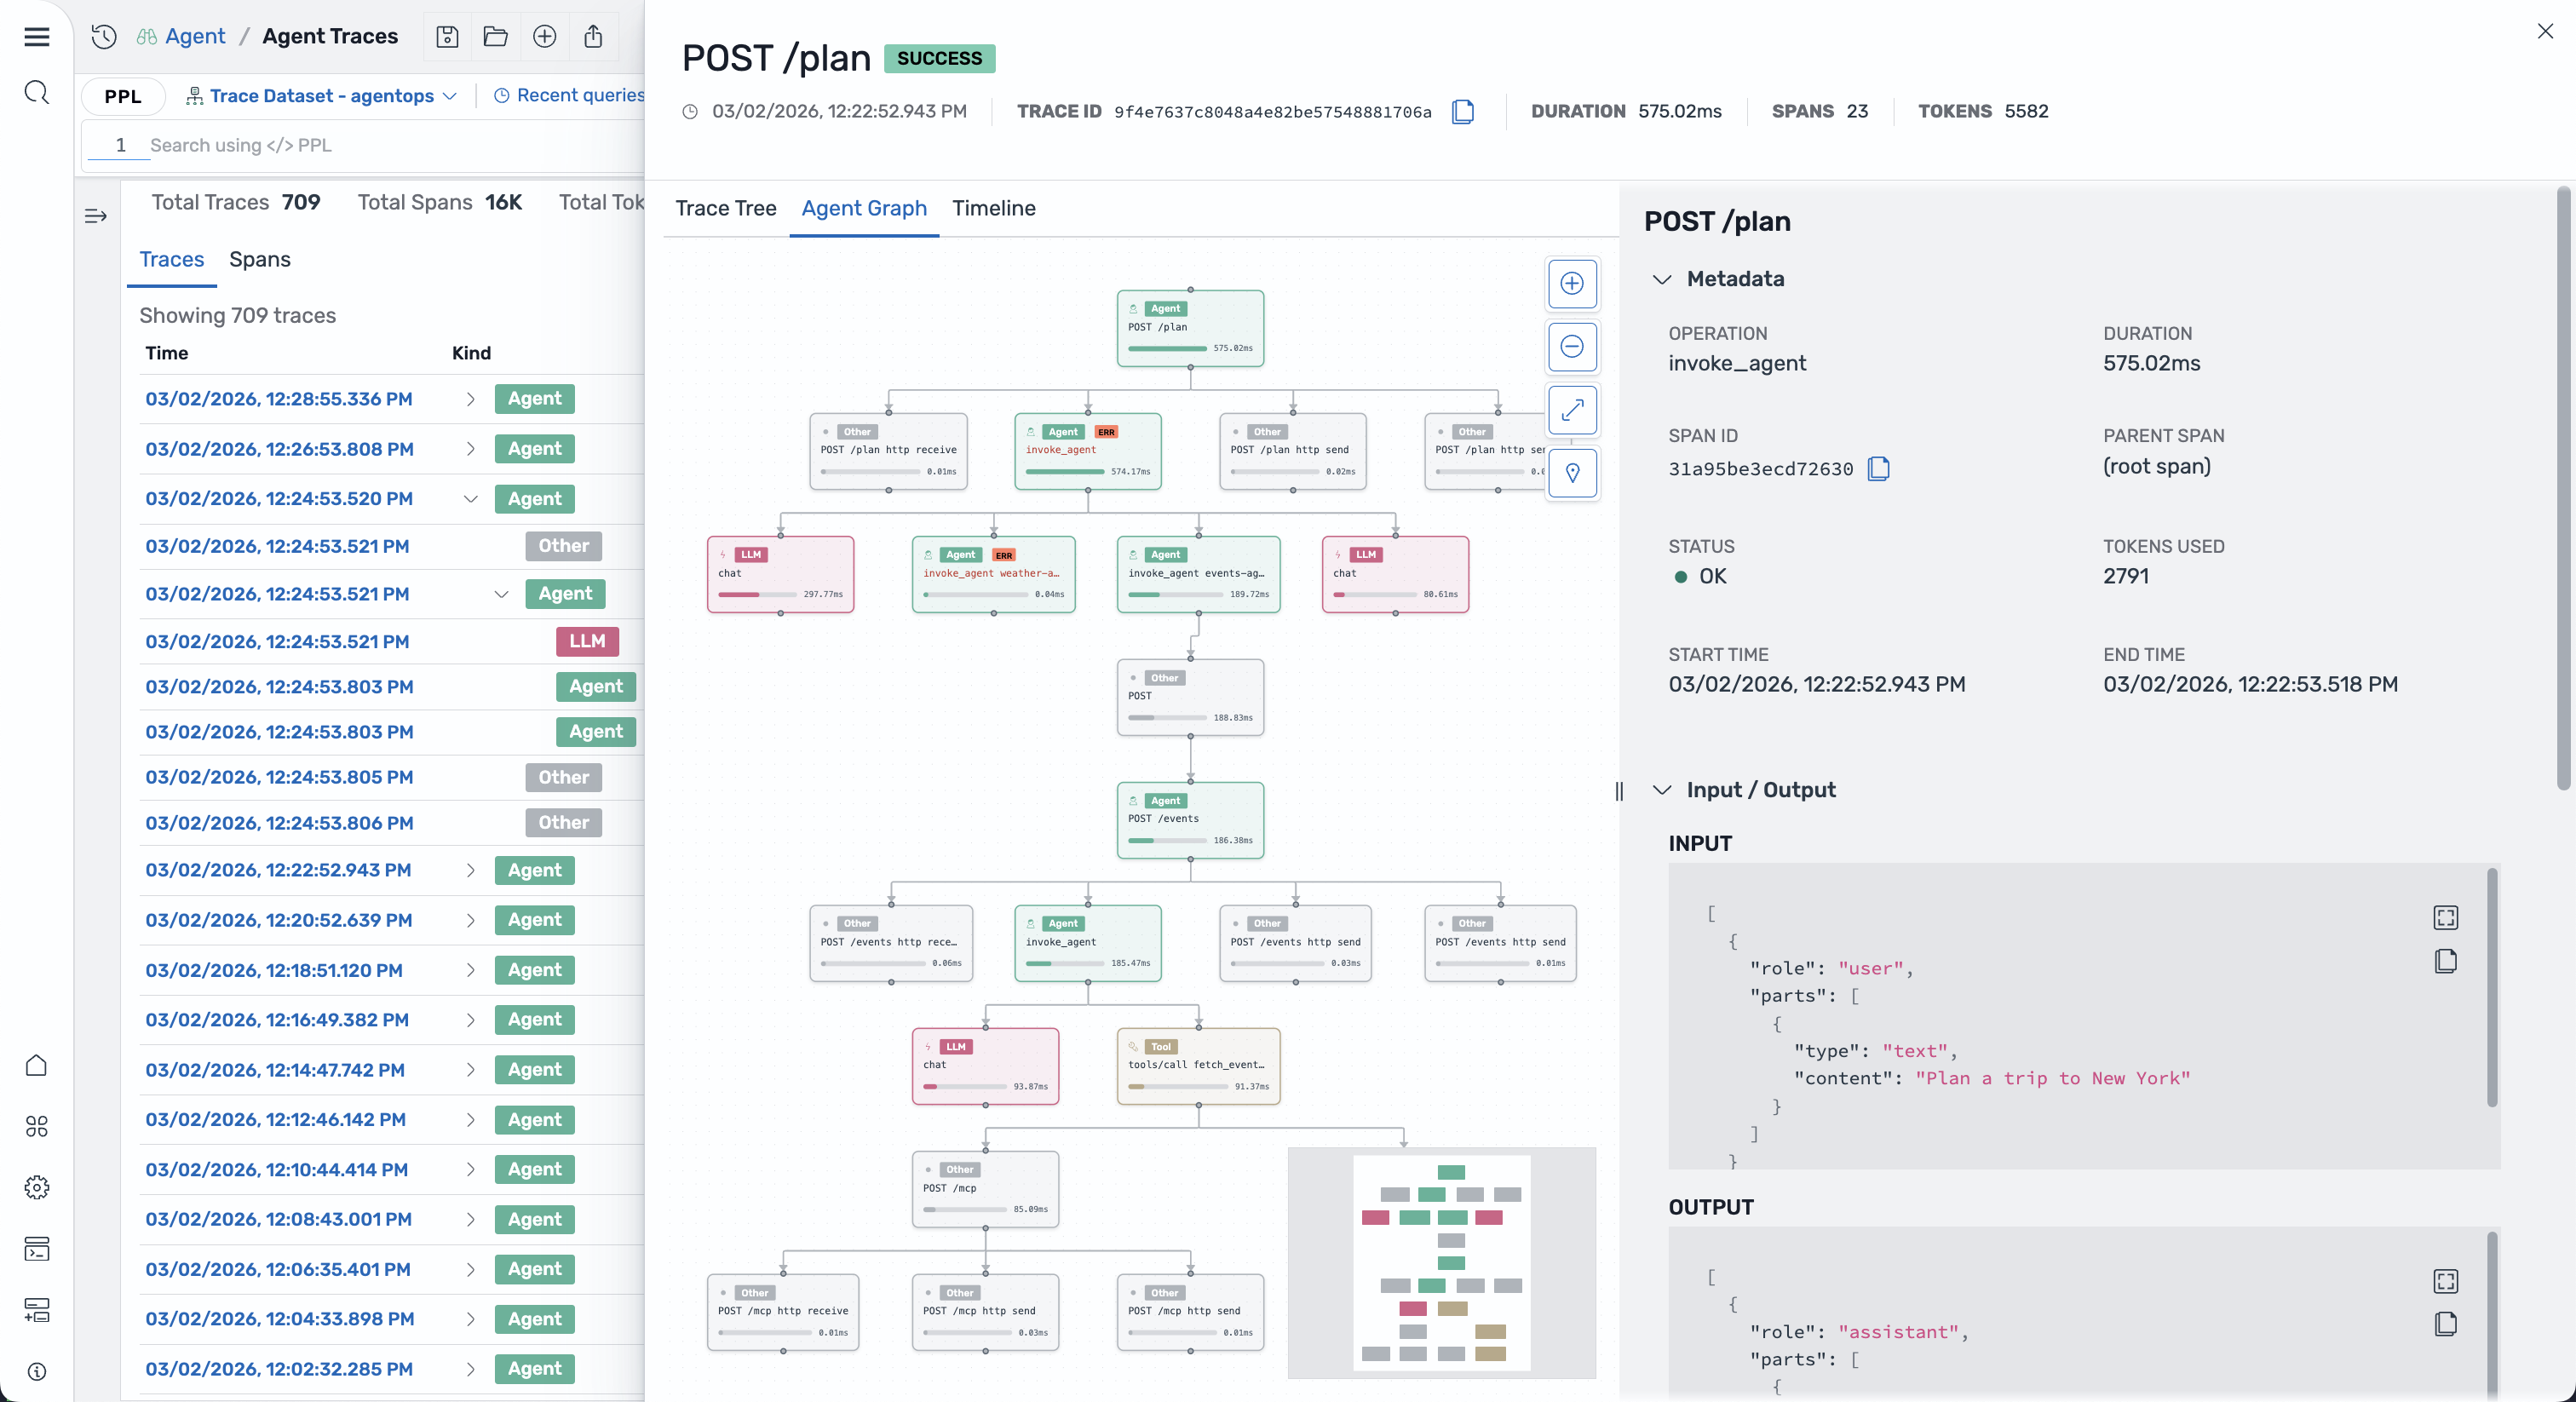
Section titled “Agent graph”The Agent Graph tab renders the trace as a directed acyclic graph (DAG) using the Dagre layout algorithm, as shown in the following image. Parent spans flow downward to child spans, and siblings at the same depth are arranged horizontally.
Node display
Section titled “Node display”Each node in the graph displays the following information:
- Category badge: A color-coded badge indicating the span category (Agent, LLM, Tool, and others).
- Span name: The operation name, truncated to 37 characters.
- Duration bar: A progress bar showing the span’s duration as a percentage of the total trace duration, with the formatted latency value.
- Error indicator: A red “ERR” badge appears on spans with an error status.
Nodes are styled with a border and background tinted to match the span category color.
Edges represent parent-child relationships between spans. Each edge is drawn as a smooth-step curve with a closed arrowhead pointing from parent to child.
Controls
Section titled “Controls”The agent graph provides the following controls in the top-right corner:
- Zoom in / Zoom out: Adjust the zoom level (range: 0.1x to 2x).
- Fit view: Automatically fit all nodes within the viewport.
- Minimap toggle: Show or hide a minimap for navigating large graphs. The minimap is interactive and supports panning and zooming. Nodes in the minimap are colored by span category.
You can also pan by clicking and dragging the background, and zoom with the mouse wheel.
Interactions
Section titled “Interactions”- Select a node: Click a node to select the span and view its details in the right panel.
- Deselect: Click the background to clear the selection.
Trace tree view
Section titled “Trace tree view”The Trace tree tab displays all spans in a hierarchical tree structure, as shown in the following image. Each row shows the span’s category badge, name, token count, and latency. You can expand and collapse nodes to navigate the hierarchy.
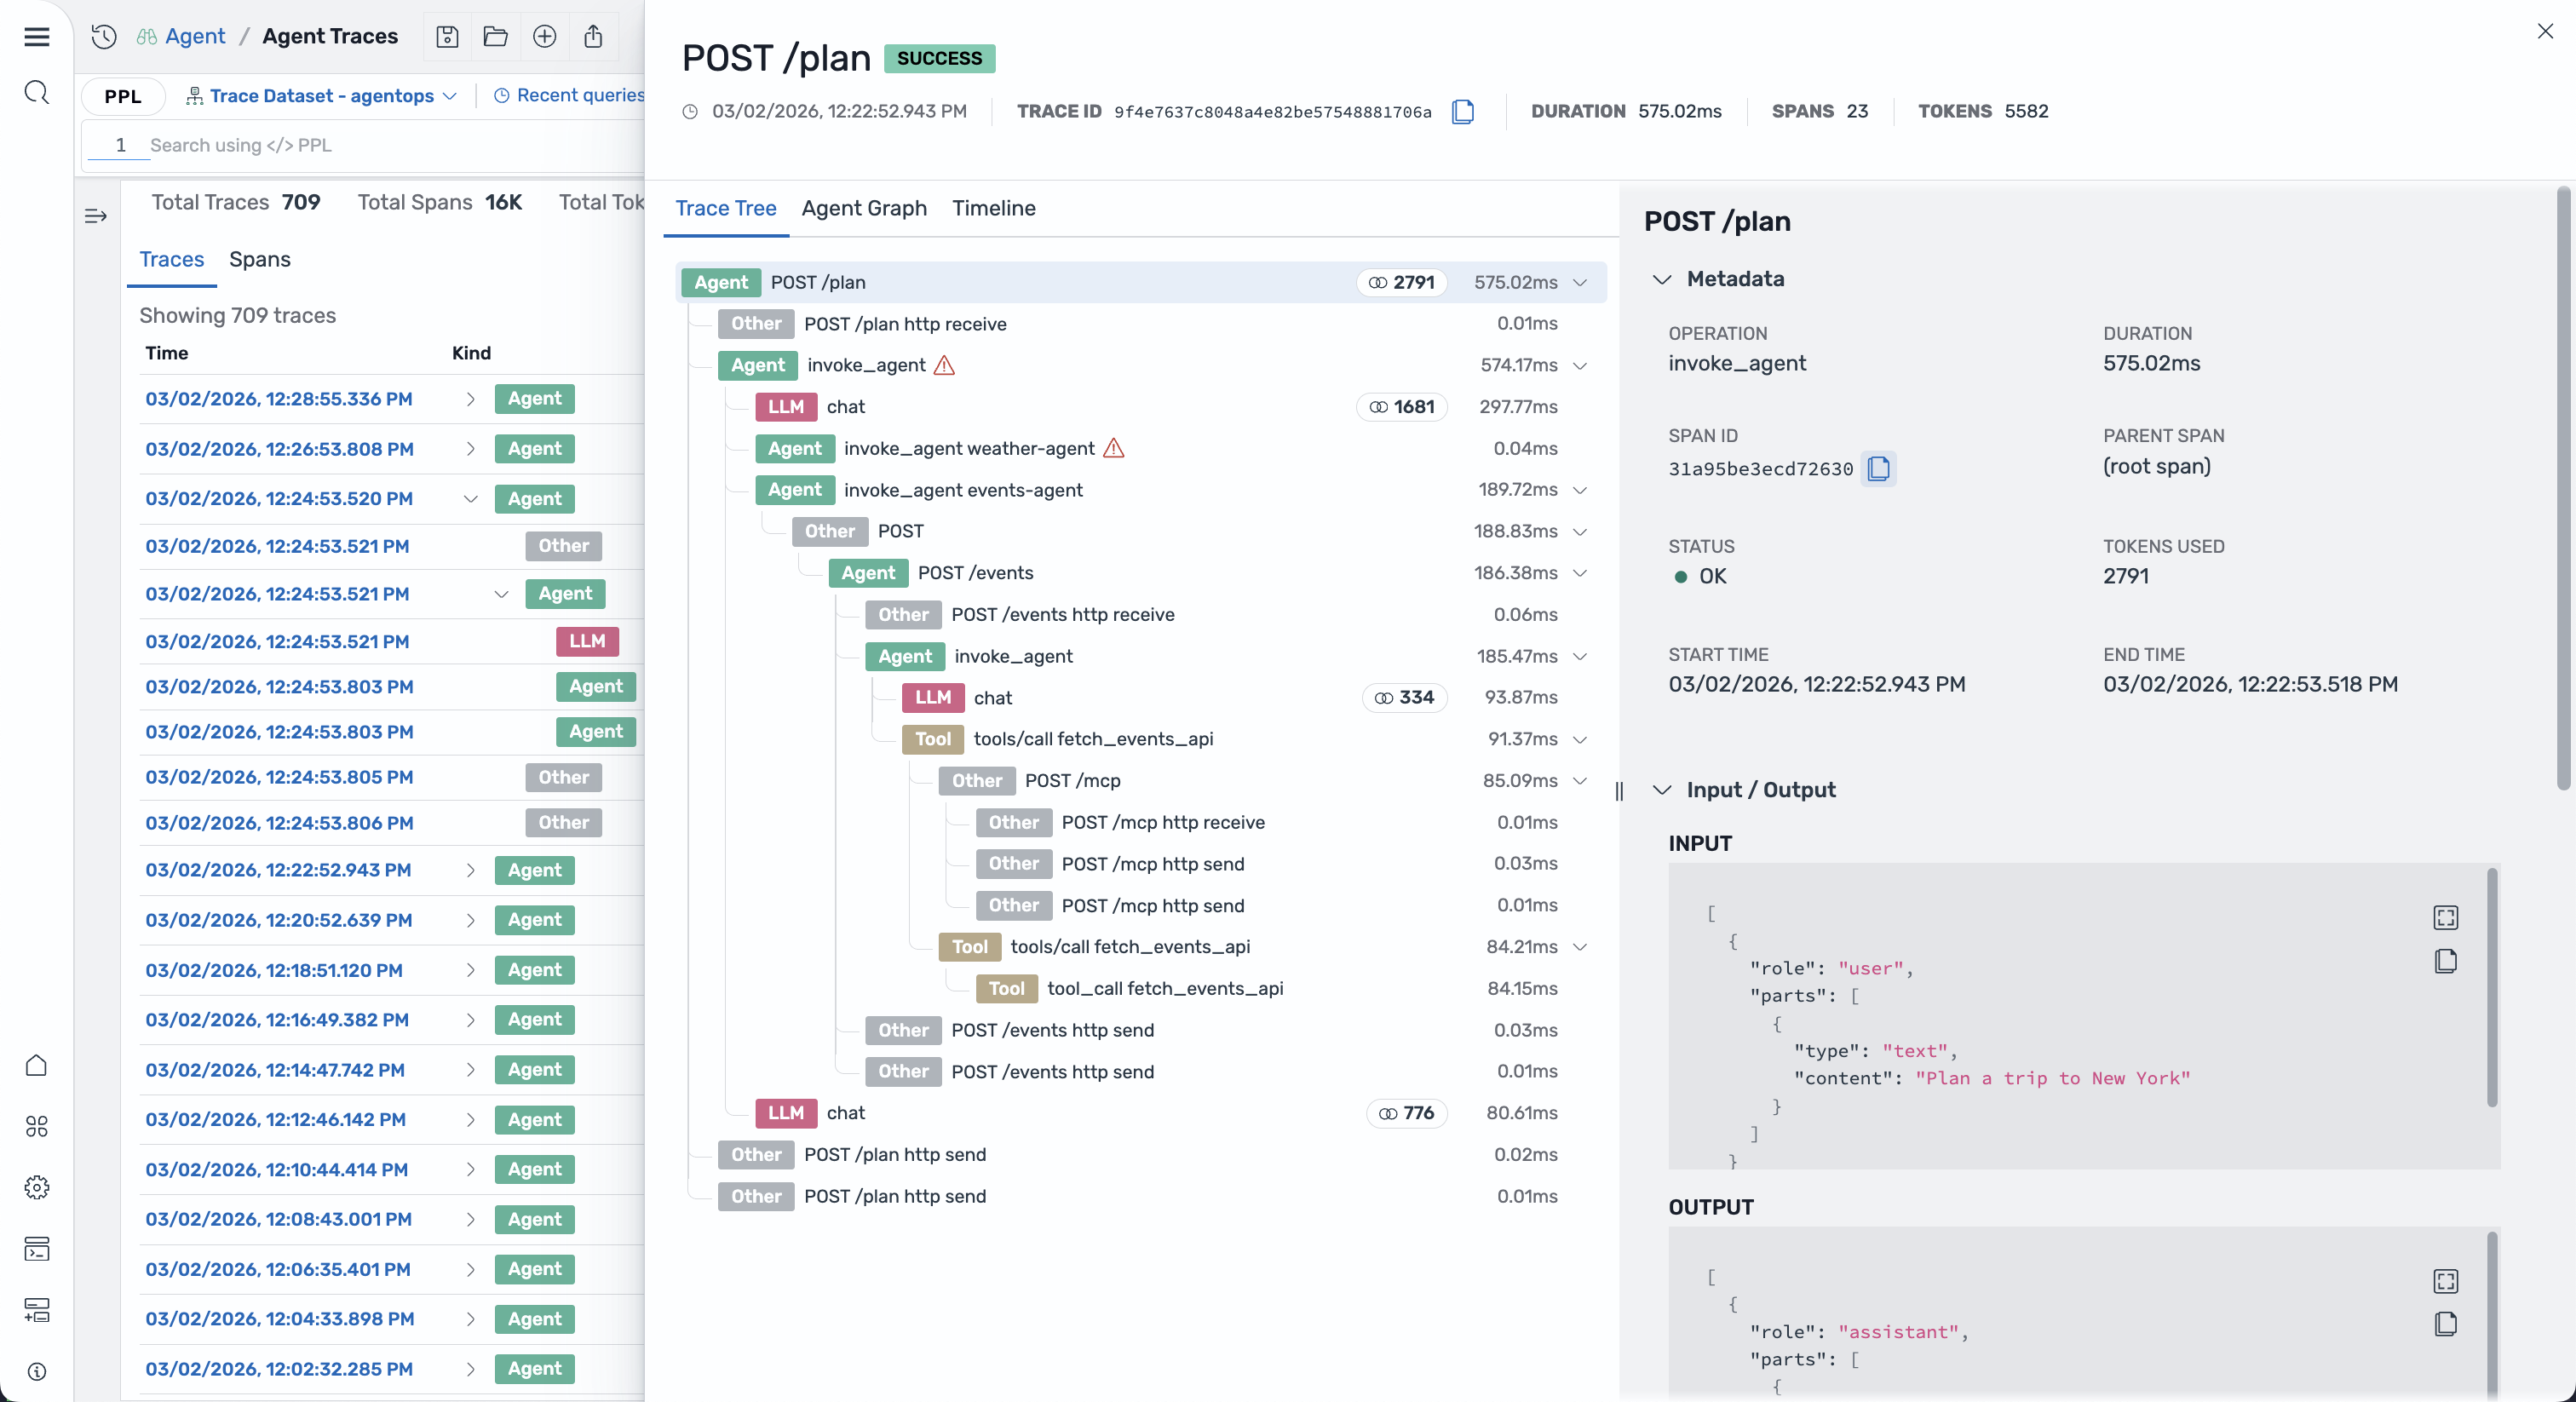
Selecting a row highlights the corresponding node in the agent graph and timeline.
Timeline view
Section titled “Timeline view”The Timeline tab presents a Gantt-style chart showing all spans arranged chronologically, as shown in the following image. Each span is rendered as a horizontal bar:
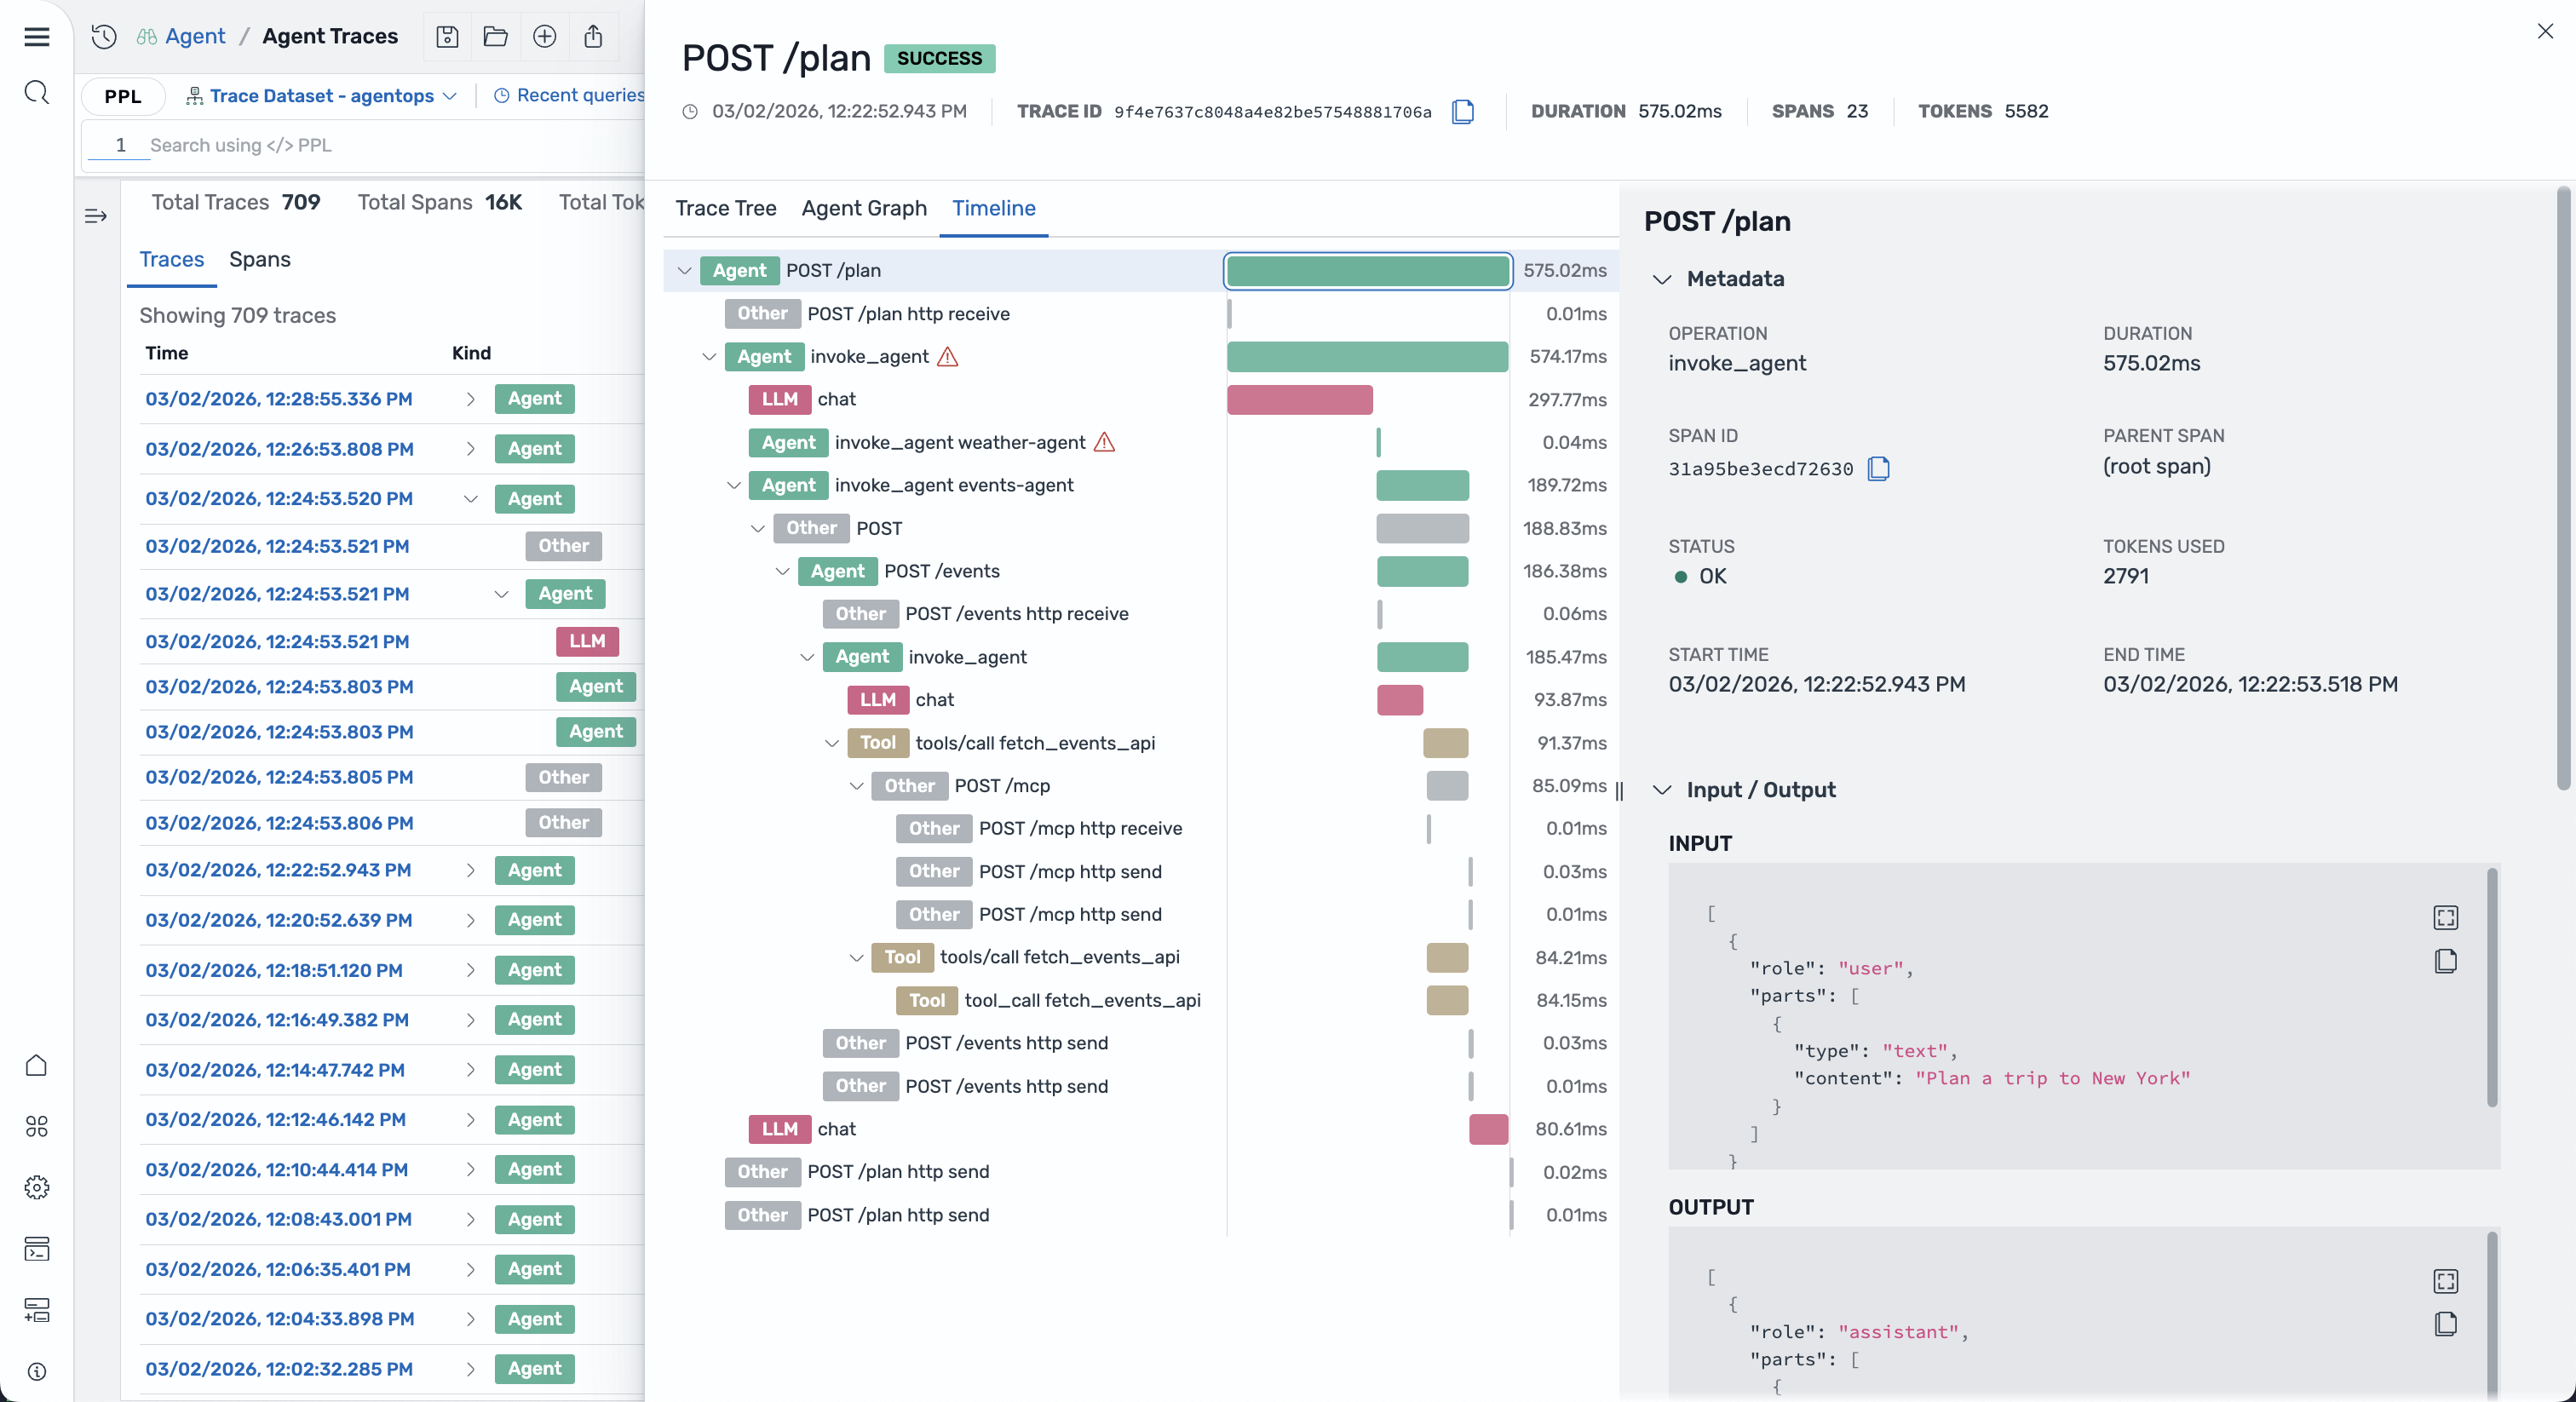
- Bar width: Proportional to the span’s duration relative to the trace.
- Bar color: Matches the span category color.
- Indentation: Reflects the span’s depth in the hierarchy.
Hover over a bar to see a tooltip with span details. Click a bar to select it and synchronize with the tree and agent graph views.
The timeline is useful for identifying performance bottlenecks and understanding which operations run in sequence versus in parallel.
Span categories
Section titled “Span categories”Spans are categorized based on the gen_ai.operation.name attribute and displayed with distinct colors:
| Operation name | Category | Color |
|---|---|---|
invoke_agent, create_agent | Agent | Blue |
chat | LLM | Orange |
text_completion, generate_content | Content | Teal |
execute_tool | Tool | Purple |
embeddings | Embeddings | Green |
retrieval | Retrieval | Red |
| Other | Other | Gray |
These colors are consistent across all three views, including the minimap.