Application Monitoring
Application Monitoring gives you a real-time view of how your services are performing. It combines topology data stored in OpenSearch with time-series RED metrics (Rate, Errors, Duration) stored in Prometheus to surface health, latency, throughput, and error information across your distributed system.
Navigation
Section titled “Navigation”In OpenSearch Dashboards, navigate to Observability > Application Monitoring. The sidebar shows:
- Services — catalog of all instrumented services with filtering, detail views, and correlation links
- Application Map — interactive topology graph of service dependencies
Key capabilities
Section titled “Key capabilities”Application Map
Section titled “Application Map”A live topology view of your distributed system. Filter by fault rate, error rate, or environment. Group services by any attribute configured in Data Prepper (such as telemetry.sdk.language). Click any service node to see health breakdowns and metric charts in a side panel. See Application Map for details.
Services catalog
Section titled “Services catalog”A filterable table of all instrumented services showing latency (P99), throughput, failure ratio, and environment. Panels above the table highlight the top services and dependency paths by fault rate. See Services for details.
Service detail
Section titled “Service detail”Drill into any service to see three tabs:
- Overview — KPI cards (throughput, fault rate, error rate, availability, latency P99) with sparklines and trend arrows, latency by dependencies, requests by operations, and availability by operations charts.
- Operations — table of all operations with expandable rows showing per-operation request, fault, error, and latency charts.
- Dependencies — table of downstream dependencies with expandable rows showing per-dependency charts.
Correlations
Section titled “Correlations”From any service or operation, open correlation flyouts to jump directly to related spans and logs. Correlation icons appear throughout the Services and Operations tables, linking APM data to the traces and logs in the Investigate section.
How it works
Section titled “How it works”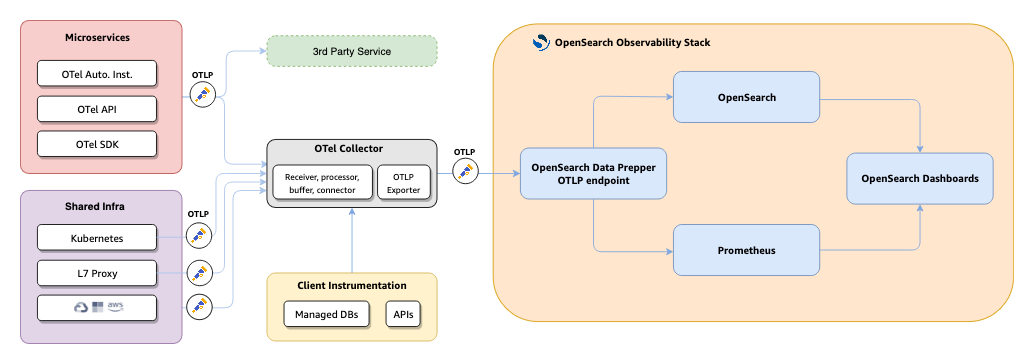
- Your applications and infrastructure emit telemetry via OpenTelemetry SDKs, auto-instrumentation, or the OTel API to the OTel Collector.
- The Collector forwards trace data to Data Prepper over OTLP.
- Data Prepper’s
otel_apm_service_mapprocessor extracts service-to-service relationships and computes RED metrics. - Topology and raw trace data are indexed into OpenSearch. RED metrics are exported to Prometheus via remote write.
- OpenSearch Dashboards queries both stores to render the Application Map, Services catalog, and service detail views.
Prerequisites
Section titled “Prerequisites”- Data Prepper running with the trace analytics pipelines enabled (see Application Map for the full pipeline configuration)
- Trace data flowing via OTLP to the OTel Collector
- Prometheus configured to receive remote write from Data Prepper
- OpenSearch Dashboards with the Observability plugin