Configuring APM in OpenSearch Dashboards
After ingesting telemetry data using the OpenTelemetry Collector and Data Prepper, you need to configure APM in OpenSearch Dashboards. You’ll create datasets, configure index patterns, attach a Prometheus data source, and configure APM settings in your workspace.
Tip: If your indexes follow the OpenTelemetry naming conventions (
otel-v1-apm-span*for traces andlogs-otel-v1*for logs), OpenSearch Dashboards can automatically create datasets and correlations for you. Navigate to Discover > Traces and select the Create Trace Datasets button when prompted. This skips Steps 1 and 2 below. For more details, see Automatic dataset creation.
Step 1: Create datasets for logs and traces
Section titled “Step 1: Create datasets for logs and traces”If your indexes use custom naming conventions and automatic creation is not available, create datasets manually in your Observability workspace:
- Navigate to your Observability workspace.
- Select Datasets and then select Create dataset.
- Create a traces dataset pointing to your trace data index (for example,
otel-v1-apm-span-*). - Create a logs dataset pointing to your application logs index (for example,
logs-otel-v1-*).
For detailed instructions on creating and configuring datasets, see Datasets.
Step 2: Create a correlation between trace and log datasets
Section titled “Step 2: Create a correlation between trace and log datasets”If you created datasets manually in Step 1, link the trace and log datasets so that APM can display related logs when you investigate traces:
- Navigate to Datasets > Correlations.
- Select the trace dataset you created in Step 1.
- Add the logs dataset as a correlated dataset.
- Save the correlation.
This enables in-context log correlations throughout the APM interface, including the Services and Application Map pages. For detailed instructions, see Correlations.
Step 3: Create an index pattern for the service map
Section titled “Step 3: Create an index pattern for the service map”APM requires an index pattern for the service map data generated by the otel_apm_service_map processor in Data Prepper. To create an index pattern, follow these steps:
- Navigate to Dashboards Management > Index patterns.
- Select Create index pattern.
- Enter
otel-v2-apm-service-map*as the index pattern name. - Select the appropriate time field and save.
This index pattern is used by APM to display service topology data and dependency information.
Step 4: Attach a Prometheus data source to your workspace
Section titled “Step 4: Attach a Prometheus data source to your workspace”APM uses Prometheus to store and query Rate, Errors, Duration (RED) metrics. To add a Prometheus data source to your workspace, follow these steps:
- Navigate to Dashboards Management > Data sources.
- Select Create data source and choose Prometheus.
- Enter the connection details for your Prometheus instance (for example,
http://prometheus:9090). - Save the data source and attach it to your Observability workspace.
For detailed instructions on configuring a Prometheus data source, see Discover Metrics.
Step 5: Configure APM settings
Section titled “Step 5: Configure APM settings”To configure APM settings, follow these steps:
-
Navigate to APM > Services or APM > Application Map.
-
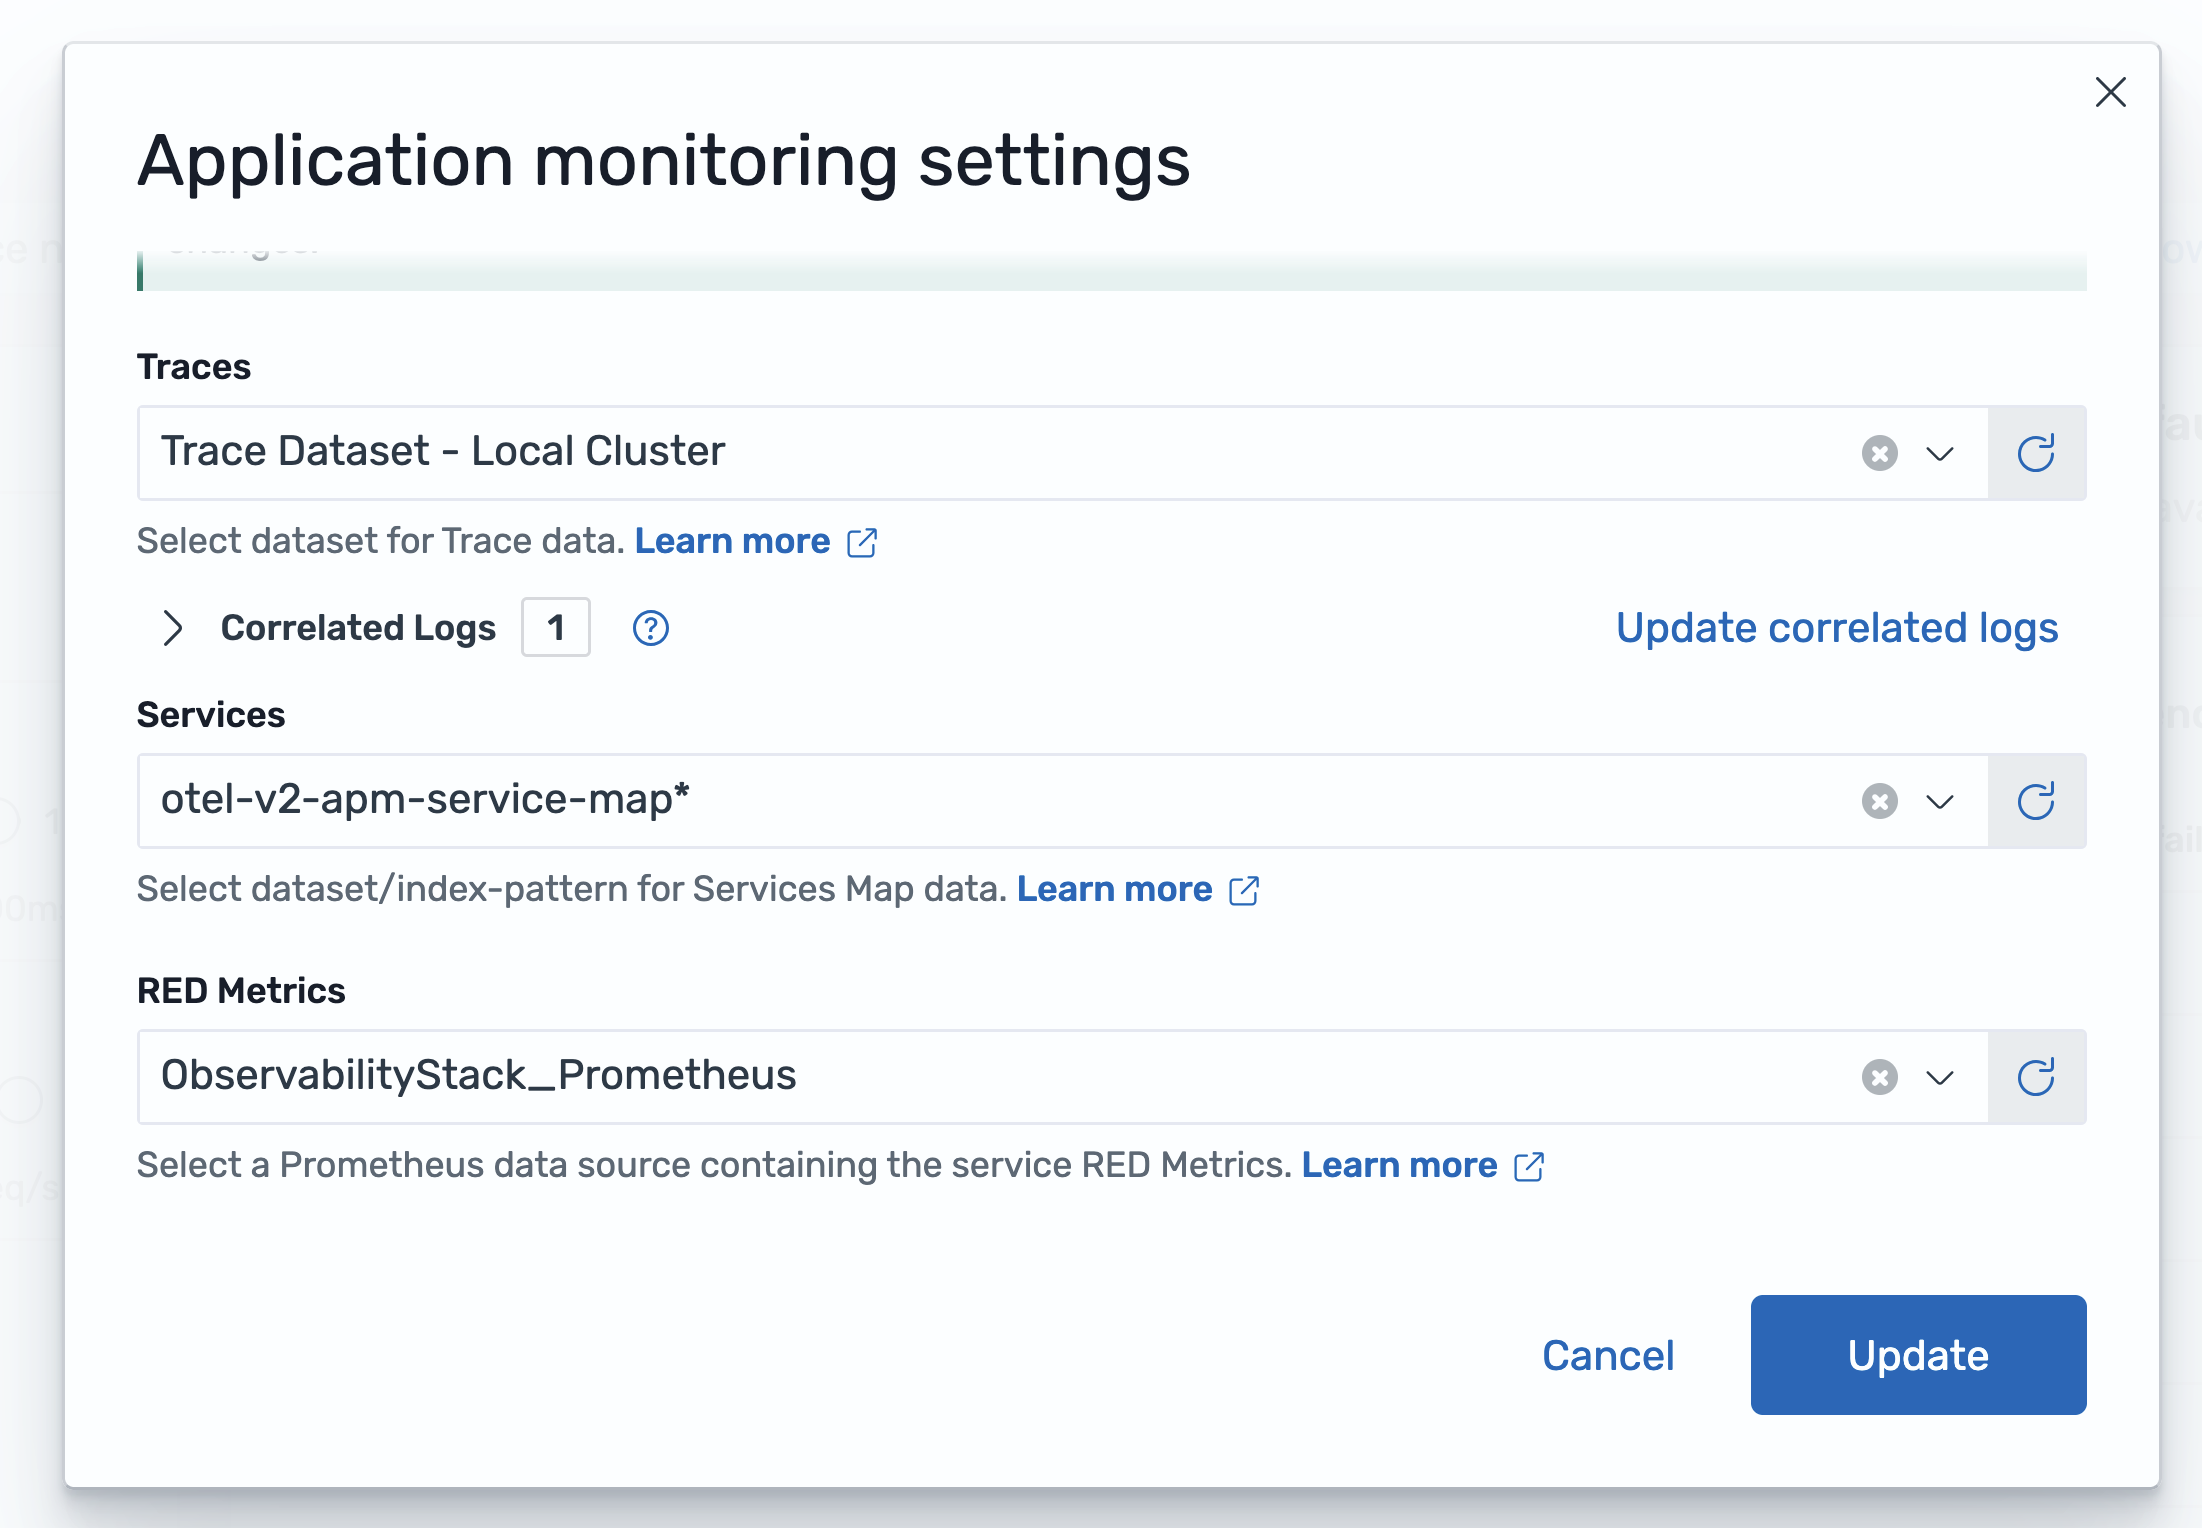
Select the APM Settings button in the upper-right corner. The Application monitoring settings dialog appears, as shown in the following image.
-
In the Application monitoring settings dialog, configure the following settings:
- Traces: Select the trace dataset you created in Step 1 (for example,
Trace Dataset - Local Cluster). The number of correlated logs is displayed below the selection. - Services: Select the service map index pattern you created in Step 3 (for example,
otel-v2-apm-service-map*). - RED Metrics: Select the Prometheus data source you configured in Step 4 (for example,
ObservabilityStack_Prometheus).
- Traces: Select the trace dataset you created in Step 1 (for example,
-
Select Update to save your configuration.
After completing this setup, APM will display service topology, RED metrics, and in-context correlations across the Services and Application Map pages.
Next steps
Section titled “Next steps”- Services: View service performance metrics and dependencies.
- Application Map: Explore the service topology visualization.