Platform Overview
The OpenSearch Observability Stack is built on open standards with OpenTelemetry at its core. Every component is open-source and runs in Docker containers on your machine.
Architecture
Section titled “Architecture”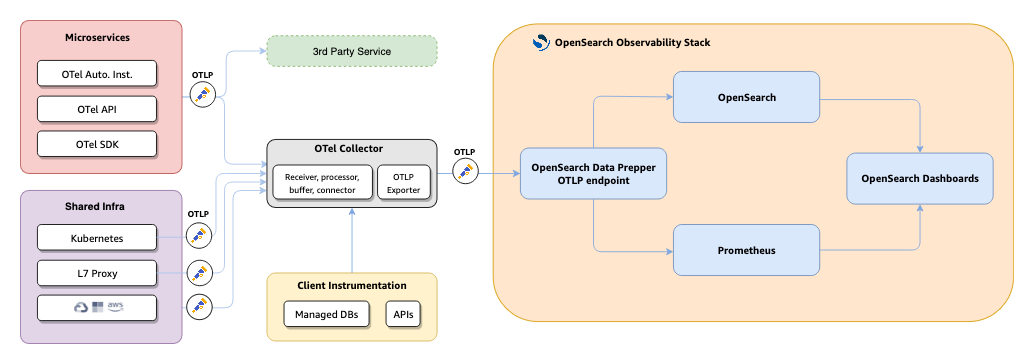
Data flow
Section titled “Data flow”- Instrumentation: Your applications send traces, logs, and metrics via OTLP to the OTel Collector.
- Collection: The OTel Collector batches, processes, and routes data to downstream systems.
- Processing: Data Prepper ingests trace data, builds service maps, and computes RED metrics (request rate, error rate, duration).
- Storage: OpenSearch indexes traces and logs. Prometheus stores time-series metrics.
- Visualization: OpenSearch Dashboards provides trace exploration, agent trace views, PromQL-based metric charts, and service maps.
Key design decisions
Section titled “Key design decisions”- OpenTelemetry-native: All data ingestion uses OTel protocols and semantic conventions. No proprietary agents.
- GenAI semantic conventions: AI agent traces use the standard
gen_ai.*OTel attributes, enabling interoperability with any OTel-compatible tool. - PPL and PromQL: Query traces and logs with PPL (Piped Processing Language) and metrics with PromQL.
- Local-first: The entire stack runs on your machine via Docker Compose. No cloud account or external dependencies required.