PPL for DQL/Lucene Users
If you are coming from OpenSearch Dashboards Query Language (DQL) or Lucene query syntax, you may be looking for the language dropdown in Discover. The Observability Stack defaults to PPL in the observability workspace because PPL covers every DQL/Lucene use case and goes far beyond what those query languages can express.
This guide maps the patterns you already know to their PPL equivalents so you can be productive immediately.
Try PPL in the live playground →The only difference: : becomes =
Section titled “The only difference: : becomes =”| DQL / Lucene | PPL |
|---|---|
severityText:ERROR | severityText="ERROR" |
field1:a AND field2:b | field1="a" AND field2="b" |
severityText:ERROR OR severityText:FATAL | severityText="ERROR" OR severityText="FATAL" |
NOT severityText:DEBUG | NOT severityText="DEBUG" |
severityNumber >= 17 | severityNumber>=17 |
severityText: (ERROR OR WARN) | severityText IN ("ERROR", "WARN") |
Both the search keyword and source= are optional and can be omitted:
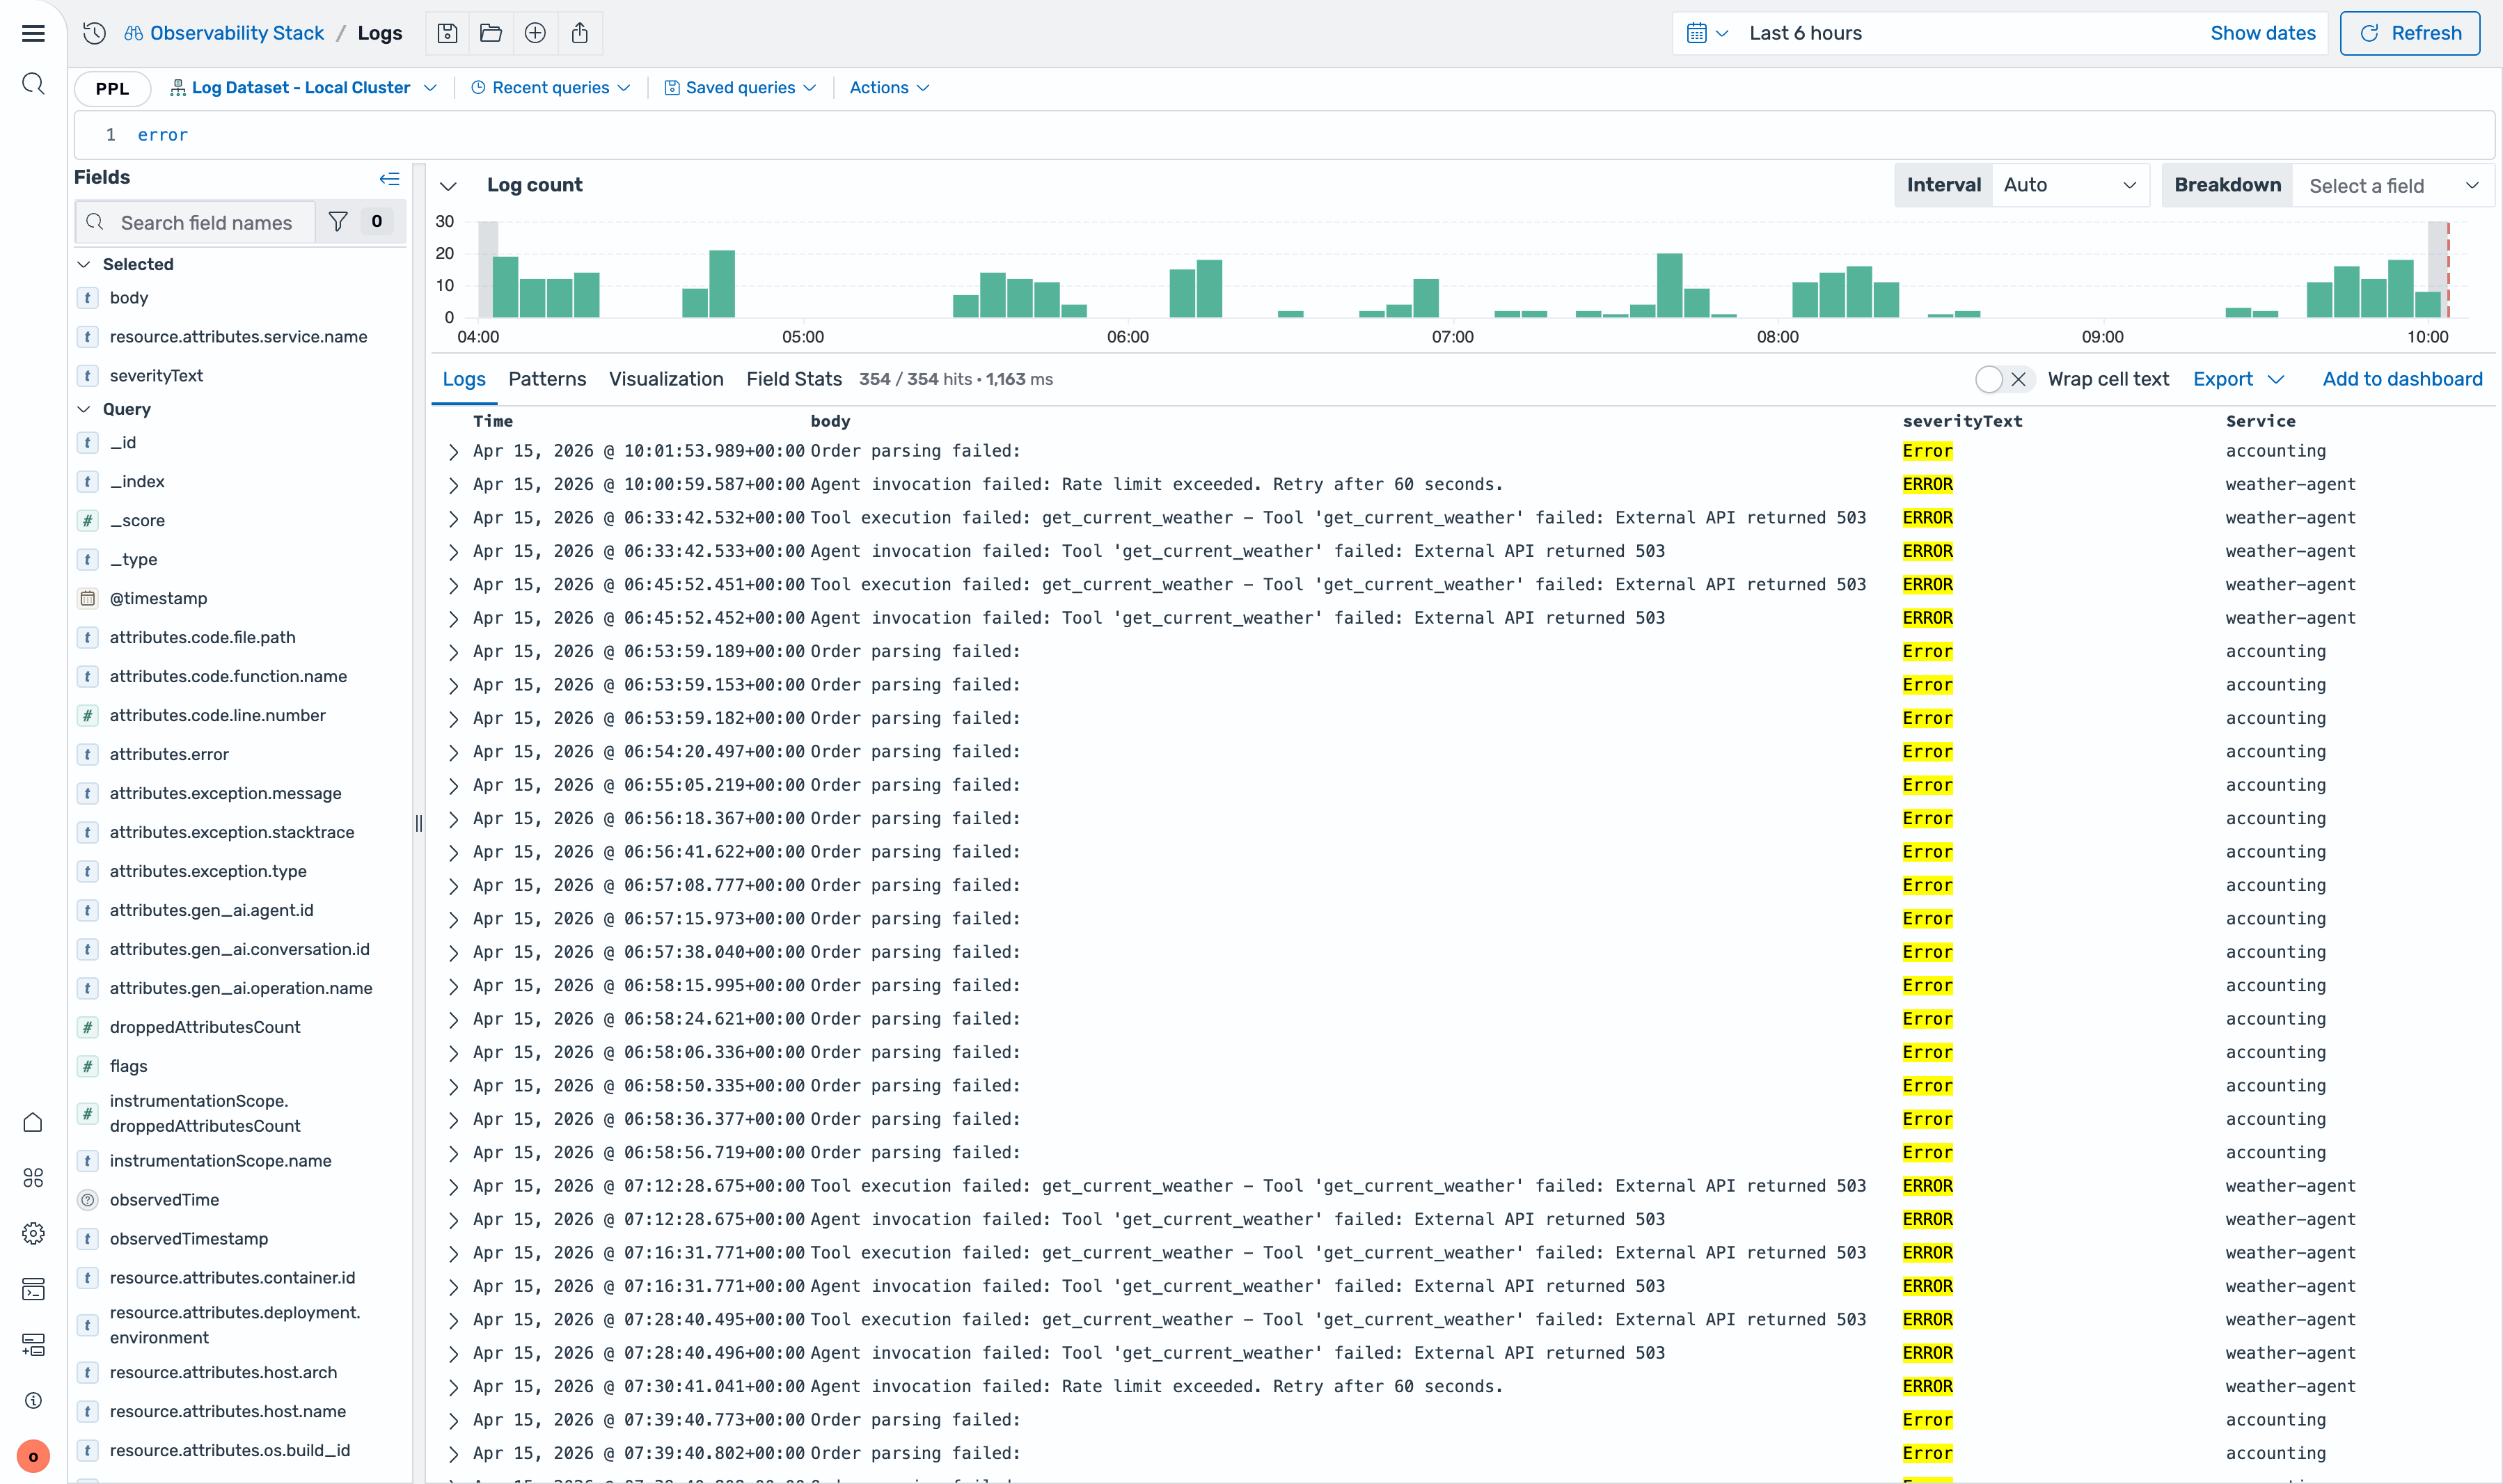
searchkeyword: Always optional.search source=logs-otel-v1* severityText="ERROR"andsource=logs-otel-v1* severityText="ERROR"are identical.source=clause: In the Discover UI, the dataset picker sets your index automatically. You just type the filter expression directly in the search bar - exactly like DQL.
It works just like DQL in the Discover UI
Section titled “It works just like DQL in the Discover UI”In the Discover UI, you select your dataset from the dataset picker dropdown. This sets the source= automatically - you never need to type it. Your query starts directly with the filter, exactly like typing a DQL query in the search bar:
| DQL search bar | PPL search bar (Discover UI) |
|---|---|
severityText: ERROR | severityText="ERROR" |
severityText: ERROR AND service.name: cart | severityText="ERROR" AND \resource.attributes.service.name`=“cart”` |
| (empty - show all) | (empty - show all) |
The experience is the same: pick your index, type your filter, hit refresh. The dataset picker handles the index selection, so you write exactly the filter expression and nothing more.
When you want to go beyond filtering - aggregate, extract patterns, compute fields - just add a pipe (|) and keep going. That is the part DQL/Lucene cannot do.
Side-by-side: common workflows
Section titled “Side-by-side: common workflows”Free-text search
Section titled “Free-text search”This is the most familiar pattern for DQL/Lucene users - just type a word and search. It works identically in PPL:
Lucene:
errorPPL:
errorUnquoted terms in PPL work exactly like Lucene - they search across all fields. Multiple terms are combined with AND by default. Use quotes for phrase matching: "connection refused".
Filter by field value
Section titled “Filter by field value”DQL:
severityText: ERRORPPL:
severityText="ERROR"In the Discover UI, both are typed directly into the search bar. The only change is : to =.
Filter by service and severity (AND)
Section titled “Filter by service and severity (AND)”DQL:
severityText: ERROR AND resource.attributes.service.name: cartPPL:
severityText="ERROR" AND `resource.attributes.service.name`="cart"Boolean AND works identically. The only extra detail: dotted field names like resource.attributes.service.name need backticks in PPL to prevent them from being interpreted as nested object access.
Boolean OR
Section titled “Boolean OR”DQL:
severityText: ERROR OR severityText: FATALPPL:
severityText="ERROR" OR severityText="FATAL"Multi-value match (IN)
Section titled “Multi-value match (IN)”DQL:
severityText: (ERROR OR WARN OR FATAL)PPL:
severityText IN ("ERROR", "WARN", "FATAL")PPL’s IN operator is cleaner than DQL’s repeated OR syntax for matching against a set of values.
Range query
Section titled “Range query”DQL:
severityNumber >= 17PPL:
severityNumber>=17Range operators (>, <, >=, <=) are identical in both DQL and PPL.
Where PPL goes beyond DQL/Lucene
Section titled “Where PPL goes beyond DQL/Lucene”DQL and Lucene stop at filtering. Once you have your filtered results, you are limited to what the UI can do. PPL keeps going - after the filter, add a pipe (|) and chain aggregation, transformation, pattern discovery, and more. This is the power of the pipeline.
Aggregate and visualize (not possible in DQL/Lucene)
Section titled “Aggregate and visualize (not possible in DQL/Lucene)”Start with the same filter, then count and sort:
severityText="ERROR"| stats count() as errors by `resource.attributes.service.name`| sort - errorsThis filters for errors, counts them by service, and sorts by count - all in one query. The Discover UI automatically switches to a visualization view when you use stats.
Compute new fields on the fly
Section titled “Compute new fields on the fly”| stats count() as total, sum(case(severityText = 'ERROR', 1 else 0)) as errors by `resource.attributes.service.name`| eval error_rate = round(errors * 100.0 / total, 2)| sort - error_rateDiscover patterns without writing regex
Section titled “Discover patterns without writing regex”severityText="ERROR"| patterns bodyThe patterns command automatically clusters similar log messages. During incident triage, this shows the shape of the problem in seconds - no manual regex needed. This is one of PPL’s most powerful features with no equivalent in DQL or Lucene.
Time-bucketed analysis
Section titled “Time-bucketed analysis”severityText="ERROR"| timechart timefield=time span=5m count() by `resource.attributes.service.name`Extract fields from unstructured logs
Section titled “Extract fields from unstructured logs”| grok body '%{IP:client_ip} - %{DATA:user} \[%{HTTPDATE:timestamp}\] "%{WORD:method} %{DATA:url}"'| stats count() as requests by method, url| sort - requests| head 20Capabilities comparison
Section titled “Capabilities comparison”| Capability | DQL/Lucene | PPL |
|---|---|---|
| Field-value filtering | Yes | Yes (same syntax, = instead of :) |
| Boolean logic (AND/OR/NOT) | Yes | Yes (identical) |
| Full-text search | Yes | Yes (unquoted terms, identical) |
| Range queries | Yes | Yes (>=, <=, identical) |
| Regex filtering | Lucene only | Yes (regex command) |
| Aggregation | No | Yes (stats, timechart, chart) |
| Computed fields | No | Yes (eval) |
| Pattern discovery | No | Yes (patterns) |
| Field extraction | No | Yes (parse, grok, rex) |
| Deduplication | No | Yes (dedup) |
| Top/rare analysis | No | Yes (top, rare) |
| Rolling statistics | No | Yes (streamstats, trendline) |
| Cross-index joins | No | Yes (join, lookup, subquery) |
| Machine learning | No | Yes (ml, kmeans) |
| Auto visualization | No | Yes (Discover switches to chart on stats) |
Syntax tips for DQL/Lucene users
Section titled “Syntax tips for DQL/Lucene users”: becomes =
Section titled “: becomes =”This is the only operator change. Everything else carries over:
DQL: severityText: ERRORPPL: severityText="ERROR"Both search and source= can be omitted
Section titled “Both search and source= can be omitted”The full form of a PPL query is:
search source=logs-otel-v1* severityText="ERROR"But both search and source= are optional:
searchkeyword - always optional. Omit it freely.source=clause - in the Discover UI, the dataset picker sets this for you. Just type your filter.
So in the Discover UI search bar, you simply type:
severityText="ERROR"Backtick dotted field names
Section titled “Backtick dotted field names”OpenTelemetry fields contain dots. In DQL, you reference them directly. In PPL, wrap them in backticks to prevent them from being interpreted as nested object access:
DQL: resource.attributes.service.name: cartPPL: `resource.attributes.service.name`="cart"Double quotes for string values
Section titled “Double quotes for string values”PPL’s search expressions use double quotes for string values:
severityText="ERROR"Operator precedence
Section titled “Operator precedence”In PPL, OR binds tighter than AND (the opposite of SQL and Lucene). When combining both, use explicit parentheses:
(severityText="ERROR" OR severityText="FATAL") AND `resource.attributes.service.name`="cart"See also
Section titled “See also”searchcommand - Full syntax for the search command, including boolean expressions and full-text searchwherecommand - Extended filtering with functions, LIKE, BETWEEN, and computed expressions- PPL Overview - Why PPL and how it compares to other query languages
- Observability Examples - Real-world PPL queries for OTel logs, traces, and AI agent data
- Discover Logs - Using PPL in the Logs Discover interface