PPL for SPL Users
This cheat sheet helps Splunk users transition to OpenSearch’s PPL. It maps common Splunk Search Processing Language (SPL) commands to their PPL equivalents with examples using OpenTelemetry observability data.
Try PPL in the live playground →Structure and Concepts
Section titled “Structure and Concepts”| Aspect | Splunk SPL | OpenSearch PPL | Notes |
|---|---|---|---|
| Query structure | search terms | command | search term source = index | command | PPL requires explicit source at the beginning |
| Index reference | index=name* | source=name* | Different command to specify data source, PPL support referring to multiple indices |
| Raw field | Special _raw field | Identify a field in your OpenSearch data that contains the text content you want to work with (often message or content fields in log data) | Default field configured by the index.query.default_field setting (defaults to * which searches all fields) |
| Time field | Special _time field | User-specified timestamp field | PPL uses @timestamp by default |
Command Reference
Section titled “Command Reference”This table provides a mapping between Splunk SPL commands and their OpenSearch PPL equivalents:
| Splunk SPL | OpenSearch PPL | Purpose |
|---|---|---|
| dedup | dedup | Remove duplicate results |
| eval | eval | Calculate and create new fields |
| eventstats | eventstats | Calculate statistics while preserving events |
| mvexpand | expand | Expand multi-value fields |
| fields | fields | Include or exclude fields |
| fillnull | fillnull | Replace null values |
| head | head | Retrieve the first N results |
| join | join | Combine results from multiple sources |
| lookup | lookup | Enrich data with lookups |
| rare | rare | Find the least common values |
| rename | rename | Rename fields in results |
| rex | rex | Extract with regular expression pattern |
| search | search | Basic searching of data |
| sort | sort | Sort results by specified fields |
| spath | spath | Extracting fields from structured text data |
| stats | stats | Statistical aggregation of data |
| timechart | timechart | Statistical aggregation of time-series data |
| top | top | Find the most common values |
| trendline | trendline | Calculate moving averages of fields |
| where | where | Filter results based on conditions |
Example Query Conversions
Section titled “Example Query Conversions”Simple search:
- SPL:
error failed - PPL:
source=logs-otel-v1* error failed
Aggregation:
- SPL:
index=logs-otel-v1* | stats count by resource.attributes.service.name | sort -count - PPL:
source=logs-otel-v1* | stats count by `resource.attributes.service.name` | sort -count
Time-based query:
- SPL:
index=logs-otel-v1* | stats count by span(@timestamp, 5m) - PPL:
source=logs-otel-v1* | stats count by span(@timestamp, 5m)
Complex calculation:
- SPL:
index=logs-otel-v1* | eval severity_category=case(severityNumber >= 17, "high", 1==1, "low") - PPL:
source=logs-otel-v1* | eval severity_category=case(severityNumber >= 17 then "high", else "low")
Basic search and filtering
Section titled “Basic search and filtering”Simple text search
Section titled “Simple text search”Search for log entries containing specific text terms.
SPL:
error failedPPL:
source=logs-otel-v1* error failed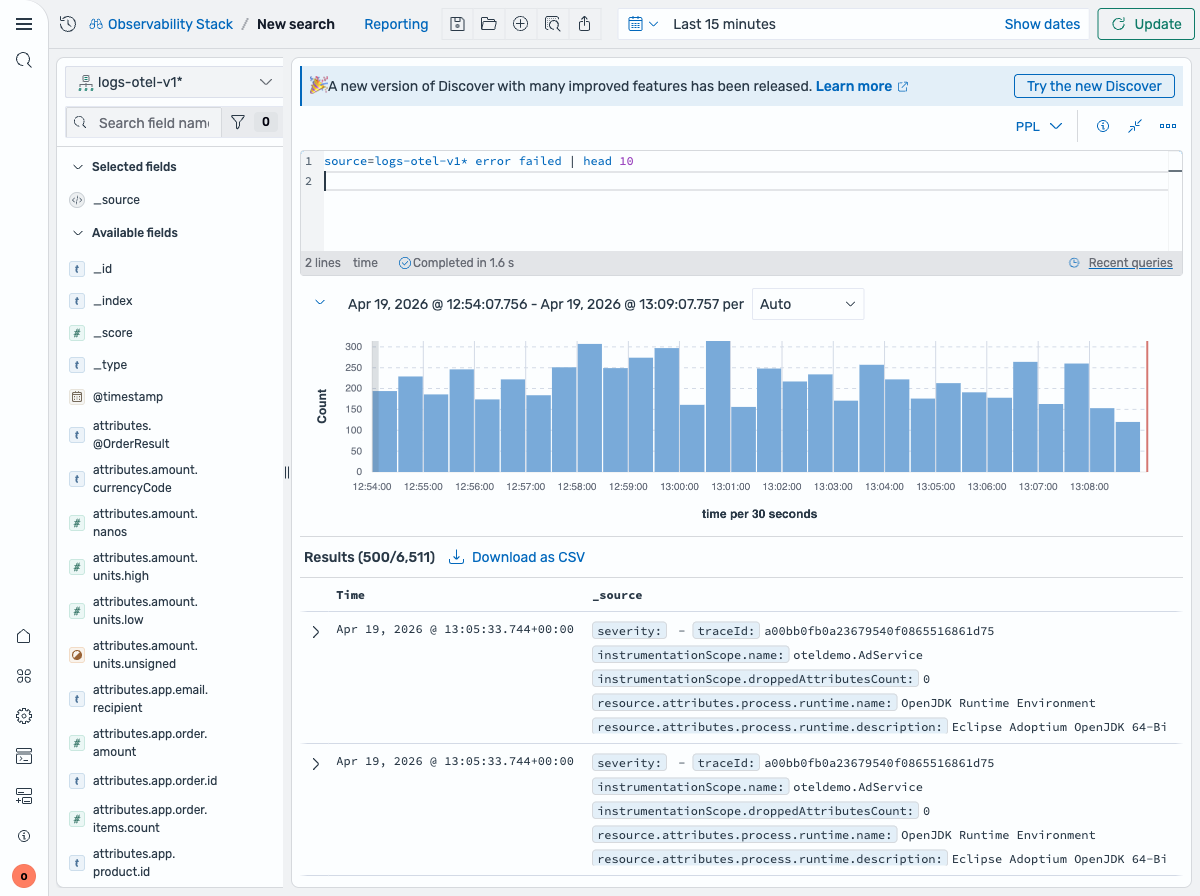
Filter by severity level
Section titled “Filter by severity level”Find logs with a specific severity level.
SPL:
index=logs-otel-v1* severityText="ERROR"PPL:
source=logs-otel-v1* severityText="ERROR"Filter by service and severity
Section titled “Filter by service and severity”Combine multiple conditions to find errors from a specific service.
SPL:
index=logs-otel-v1* resource.attributes.service.name="load-generator" AND severityText="ERROR"PPL:
source=logs-otel-v1* `resource.attributes.service.name`="load-generator" AND severityText="ERROR"Multiple severity levels
Section titled “Multiple severity levels”Find logs matching multiple severity levels using OR.
SPL:
index=logs-otel-v1* severityText="ERROR" OR severityText="WARN"PPL:
source=logs-otel-v1* severityText="ERROR" OR severityText="WARN"Aggregation and statistics
Section titled “Aggregation and statistics”Count logs by service
Section titled “Count logs by service”Count the number of log entries grouped by service name.
SPL:
index=logs-otel-v1* | stats count by resource.attributes.service.namePPL:
source=logs-otel-v1* | stats count by `resource.attributes.service.name`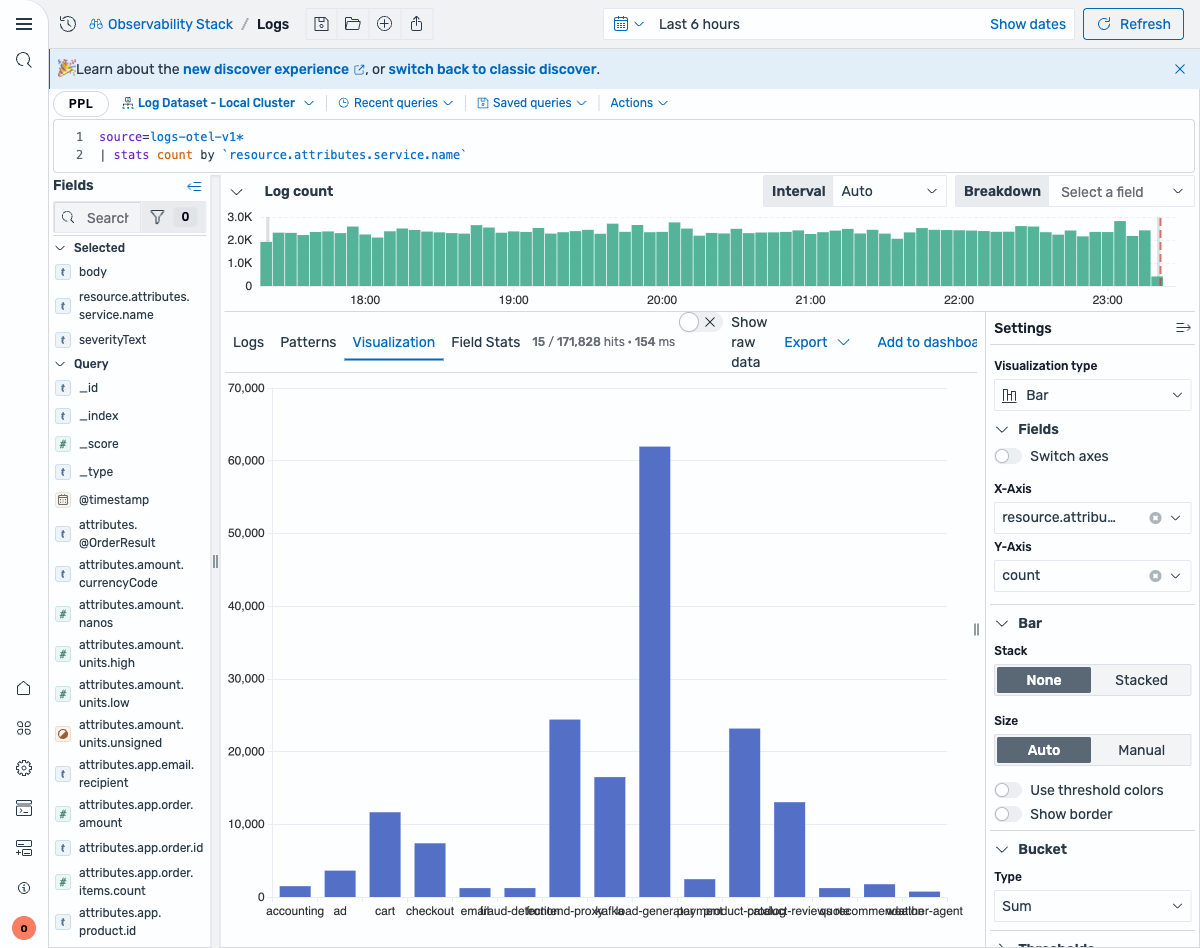
Multiple statistics per service
Section titled “Multiple statistics per service”Calculate both count and average severity for each service.
SPL:
index=logs-otel-v1* | stats count as log_count, avg(severityNumber) as avg_severity by resource.attributes.service.namePPL:
source=logs-otel-v1* | stats count as log_count, avg(severityNumber) as avg_severity by `resource.attributes.service.name`Sort results by count
Section titled “Sort results by count”Sort the aggregated results by log count in descending order.
SPL:
index=logs-otel-v1* | stats count as log_count by resource.attributes.service.name | sort -log_countPPL:
source=logs-otel-v1* | stats count as log_count by `resource.attributes.service.name` | sort -log_count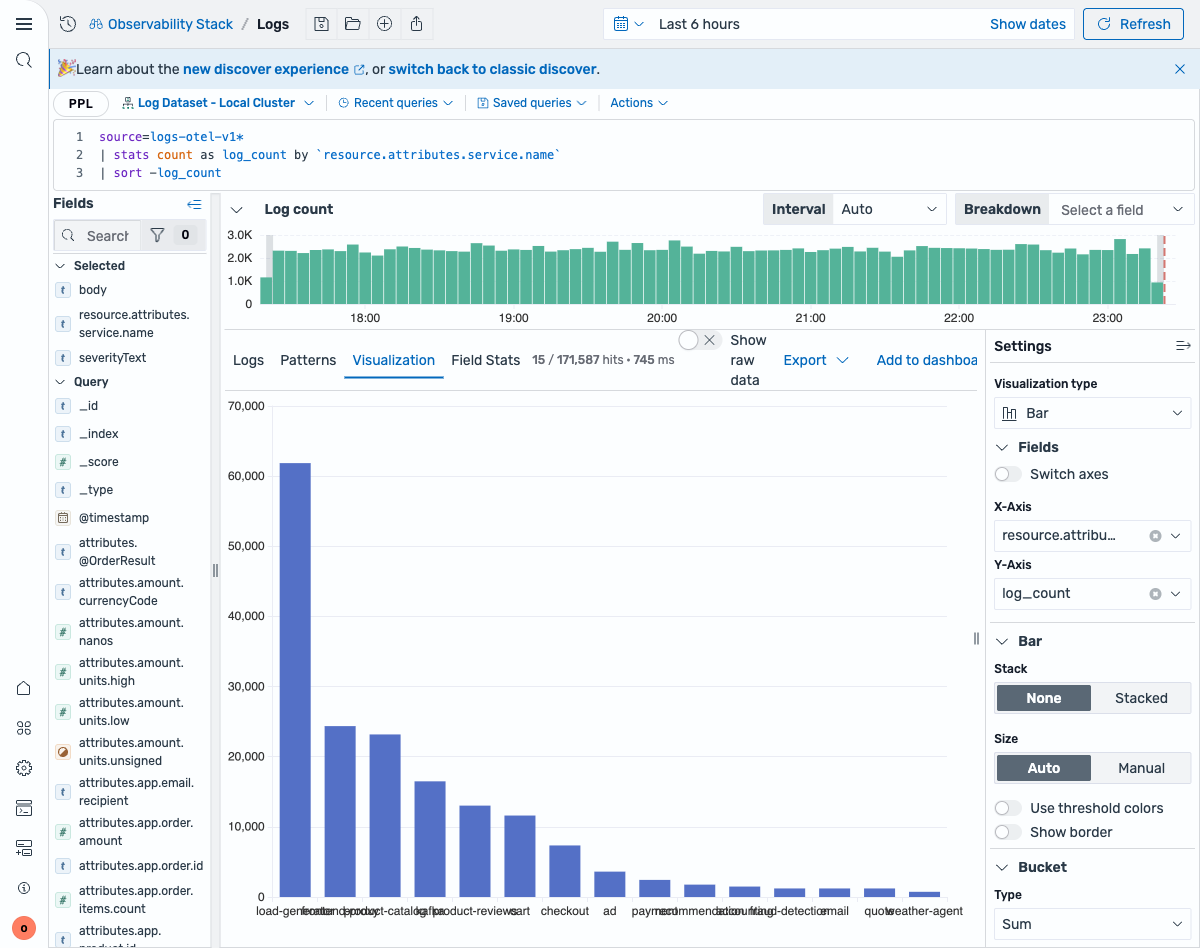
Conditional logic
Section titled “Conditional logic”Categorize severity levels
Section titled “Categorize severity levels”Create human-readable categories from numeric severity values.
SPL:
index=logs-otel-v1* | eval severity_category=case(severityNumber >= 17, "high", severityNumber >= 9, "medium", 1==1, "low")PPL:
source=logs-otel-v1* | eval severity_category=case(severityNumber >= 17, "high", severityNumber >= 9, "medium" else "low")Field operations
Section titled “Field operations”Select specific fields
Section titled “Select specific fields”Return only specific fields in the results.
SPL:
index=logs-otel-v1* | fields @timestamp, resource.attributes.service.name, severityTextPPL:
source=logs-otel-v1* | fields @timestamp, `resource.attributes.service.name`, severityTextTime-based operations
Section titled “Time-based operations”Time bucketing
Section titled “Time bucketing”Group logs into 5-minute time intervals and count by service.
SPL:
index=logs-otel-v1* | stats count by span(@timestamp, 5m) as time_bucket, resource.attributes.service.namePPL:
source=logs-otel-v1* | stats count by span(@timestamp, 5m) as time_bucket, `resource.attributes.service.name`Time series visualization
Section titled “Time series visualization”Create time-based charts showing log volume over time.
SPL:
index=logs-otel-v1* | timechart span=5m count by resource.attributes.service.namePPL:
source=logs-otel-v1* | timechart span=5m count by `resource.attributes.service.name`String operations
Section titled “String operations”Search within field
Section titled “Search within field”Use pattern matching to find logs where the body field contains “error”.
SPL:
index=logs-otel-v1* | where like(body, "%error%")PPL:
source=logs-otel-v1* | where like(body, "%error%")Create descriptive labels
Section titled “Create descriptive labels”Combine service name and severity into a readable label.
SPL:
index=logs-otel-v1* | eval service_info=resource.attributes.service.name + " (" + severityText + ")"PPL:
source=logs-otel-v1* | eval service_info=concat(`resource.attributes.service.name`, " (", severityText, ")")Deduplication and sampling
Section titled “Deduplication and sampling”Remove duplicates
Section titled “Remove duplicates”Get only one log entry per unique service name.
SPL:
index=logs-otel-v1* | dedup resource.attributes.service.namePPL:
source=logs-otel-v1* | dedup `resource.attributes.service.name`Handle missing service names
Section titled “Handle missing service names”Replace empty service names with a default value for cleaner reporting.
SPL:
index=logs-otel-v1* | fillnull value="unknown" resource.attributes.service.namePPL:
source=logs-otel-v1* | fillnull with "unknown" in `resource.attributes.service.name`See also
Section titled “See also”- PPL Overview - Complete PPL language reference
searchcommand - Full search syntaxstatscommand - Aggregation functions- Observability Examples - Real-world PPL queries for observability data