Using dashboard variables
You can reference dashboard variables in queries in the visualization editor to create dynamic, interactive dashboards.
Variable syntax
Section titled “Variable syntax”Dashboard variables can be referenced in queries using the following syntax options.
Basic syntax
Section titled “Basic syntax”Use $variableName for most cases:
source=logs | where service='$service' | stats count() by regionBraced syntax
Section titled “Braced syntax”Use ${variableName} when the variable name is followed by other characters without white space:
source = logs | where ${env}_level = "error"Braced syntax ensures that the variable name is properly delimited. Without braces, $env_level is interpreted as a variable named env_level instead of env.
Using variables in queries
Section titled “Using variables in queries”Dashboard variables support Piped Processing Language (PPL) and Prometheus Query Language (PromQL). The following examples use PPL.
Single-value variable for filtering
Section titled “Single-value variable for filtering”The following query filters logs by a single-value variable:
source=logs | where service='$service' | stats count() by status_codeWhen service is set to api, the query resolves to:
source=logs | where service='api' | stats count() by status_codeMulti-value variable for filtering
Section titled “Multi-value variable for filtering”The following query filters logs by a multi-value variable:
source=logs | where region IN $region | stats count() by serviceWhen region has multiple values selected (us-east, us-west), the query resolves to:
source=logs | where region IN ('us-east', 'us-west') | stats count() by serviceMulti-value with numbers
Section titled “Multi-value with numbers”When a query variable’s options are detected as numeric or Boolean values, multi-values are formatted without quotes:
source=logs | where status_code IN $status | stats count()When status has multiple numeric values selected, the query resolves to:
source=logs | where status_code IN (200, 404, 500) | stats count()Variable for grouping dimension
Section titled “Variable for grouping dimension”The following query uses a variable to control the grouping dimension:
source=logs | stats count() by `$group_by`When group_by is set to region, the query resolves to:
source=logs | stats count() by regionVariable for time interval
Section titled “Variable for time interval”The following query uses a variable to control the time interval:
source=logs | stats count() by span(timestamp, $interval)When interval is set to 5m, the query resolves to:
source=logs | stats count() by span(timestamp, 5m)Variable for metric calculation
Section titled “Variable for metric calculation”The following query uses a variable to control which metric is calculated:
source=metrics | stats avg($metric) by serviceWhen metric is set to response_time, the query resolves to:
source=metrics | stats avg(response_time) by serviceMulti-value variable formatting
Section titled “Multi-value variable formatting”When a variable allows multiple selections, values are automatically formatted based on the query language.
| Query language | String values | Numeric or Boolean values |
|---|---|---|
| PPL | ('value1', 'value2') |
(123, 456) |
| PromQL | (value1|value2) |
(value1|value2) |
| Other | value1, value2 |
value1, value2 |
Autocomplete suggestions
Section titled “Autocomplete suggestions”Query editors in OpenSearch Dashboards provide autocomplete suggestions for dashboard variables.
-
In the query editor, type
$. A dropdown appears showing all available dashboard variables. -
Select a variable from the list or continue typing to filter, as shown in the following image.
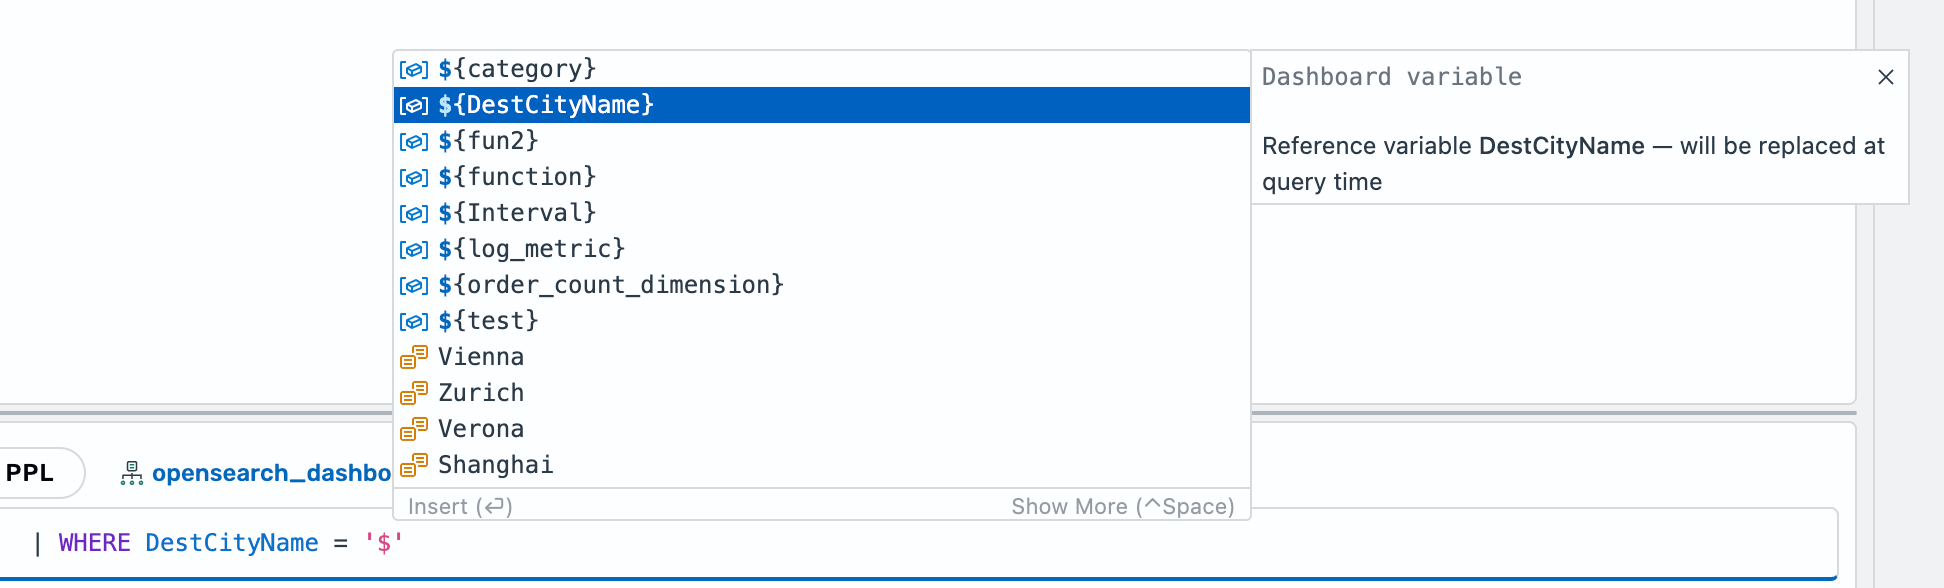
-
Press Enter or Tab to insert the variable.
Using variables in visualizations
Section titled “Using variables in visualizations”Dashboard variables integrate with the OpenSearch Dashboards visualization editor, which provides full support for dashboard variables when editing visualizations from a dashboard.
Filtering by a variable value
Section titled “Filtering by a variable value”Variables can serve as filtering conditions within your visualizations. Instead of applying filters to entire dashboards, embed variables directly into PPL queries to create targeted filtering for specific panels.
To filter a visualization by a variable value, follow these steps:
-
Create a
machine_osvariable:-
Select Dashboards in the left navigation.
-
Open an existing dashboard or select Create > Dashboard to create a new dashboard. If creating a new dashboard, save it first by entering a title and selecting Save.
-
At the top of the dashboard, select Add variable.
-
In the Name, enter
machine_os. In the Type, select Query. In the Options Query, selectopensearch_dashboards_sample_data_logs. In the query box, enter the following query:| FIELDS `machine.os` -
Select Preview and make sure that you see values such as
win 8,ios, andwin xpin the Preview of values. Then select Add variable to save.
-
-
Filter by a variable value:
- Open a new visualization editor by selecting Create new in the dashboard and then selecting Add visualization.
- In the time filter, select Last 30 days.
- In the query box, enter the following query:
| WHERE `machine.os` = '${machine_os}' | STATS avg(memory) BY span(`@timestamp`, 1d)To filter the visualization by
machine_osvalues, select the value in themachine_osdropdown list (for example, selectwin 8), as shown in the following image.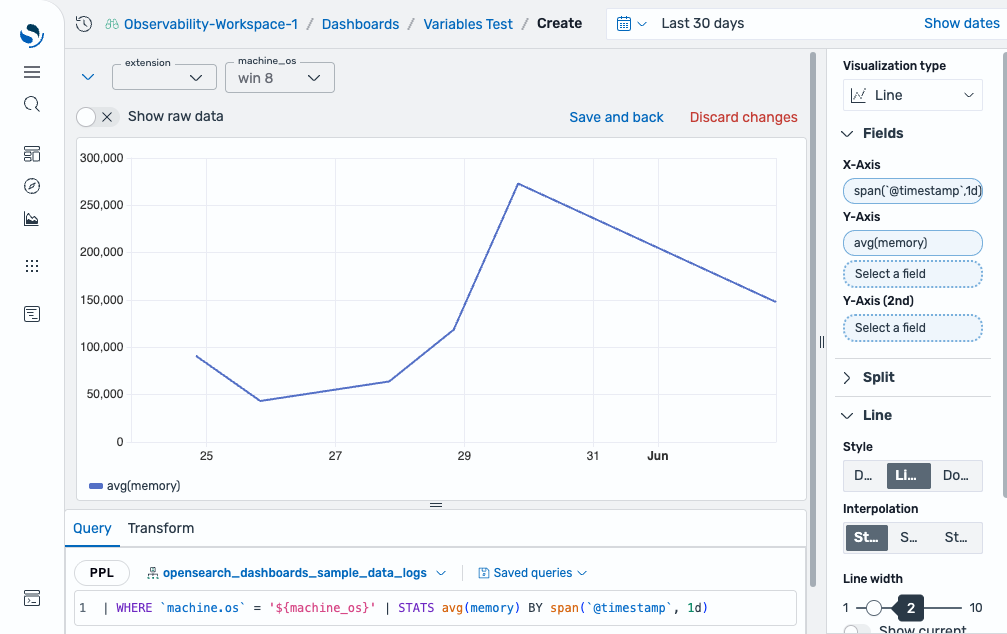
Selecting a metric dynamically
Section titled “Selecting a metric dynamically”Use a variable to control which field is used in an aggregation. This lets you switch between metrics (for example, memory and bytes) without editing the query.
To select a metric dynamically, follow these steps:
-
Create a
log_metricvariable:- Select Dashboards in the left navigation.
- Open an existing dashboard or select Create > Dashboard to create a new dashboard. If creating a new dashboard, save it first by entering a title and selecting Save.
- At the top of the dashboard, select Add variable.
- In the Name, enter
log_metric. In the Type, select Custom. In the Custom options, entermemoryand press Enter to add. Then enterbytesand press Enter to add. - Select Add variable to save.
-
Use the variable in a visualization:
-
Open a new visualization editor by selecting Create new in the dashboard and then selecting Add visualization.
-
In the time filter, select Last 30 days.
-
In the query box, enter the following query:
source=opensearch_dashboards_sample_data_logs| stats avg($log_metric) as avg_${log_metric} by span(`timestamp`, 1h) as timestamp, response
To switch between metrics, select a value in the
log_metricdropdown list (for example, selectmemoryorbytes).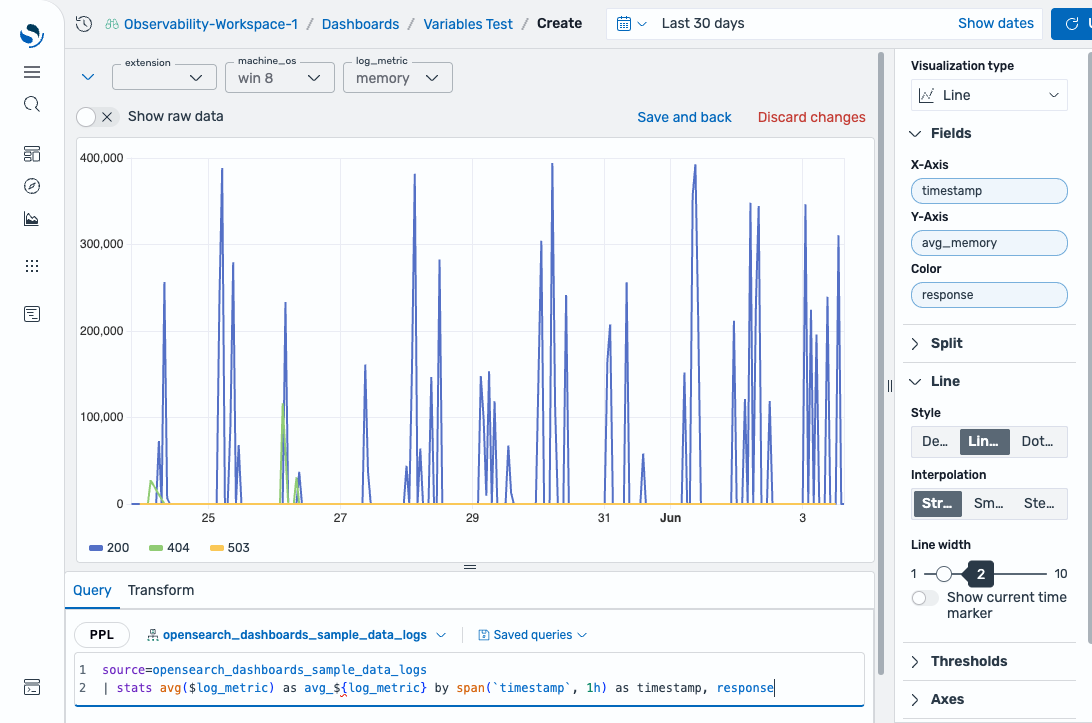
-
Changing time intervals dynamically
Section titled “Changing time intervals dynamically”Use a variable to let dashboard viewers switch between time aggregation intervals (for example, 1h, 6h, or 1d) without editing the query.
To change time intervals dynamically, follow these steps:
-
Create an
intervalvariable:- Select Dashboards in the left navigation.
- Open an existing dashboard or select Create > Dashboard to create a new dashboard. If creating a new dashboard, save it first by entering a title and selecting Save.
- At the top of the dashboard, select Add variable.
- In the Name, enter
interval. In the Type, select Custom. In the Custom options, enter1dand press Enter to add. Repeat for12h,6h, and1h. - Select Add variable to save.
-
Use the variable in a visualization:
-
Open a new visualization editor by selecting Create new in the dashboard and then selecting Add visualization.
-
In the time filter, select Last 30 days.
-
In the query box, enter the following query:
source=opensearch_dashboards_sample_data_logs | stats AVG(`bytes`) as avg_bytes, MAX(`bytes`) as max_bytes by span(`timestamp`, $interval)
To switch between intervals, select a value in the
intervaldropdown list (for example, select6h) and select Update. The visualization reflects the selected time bucketing, as shown in the following image.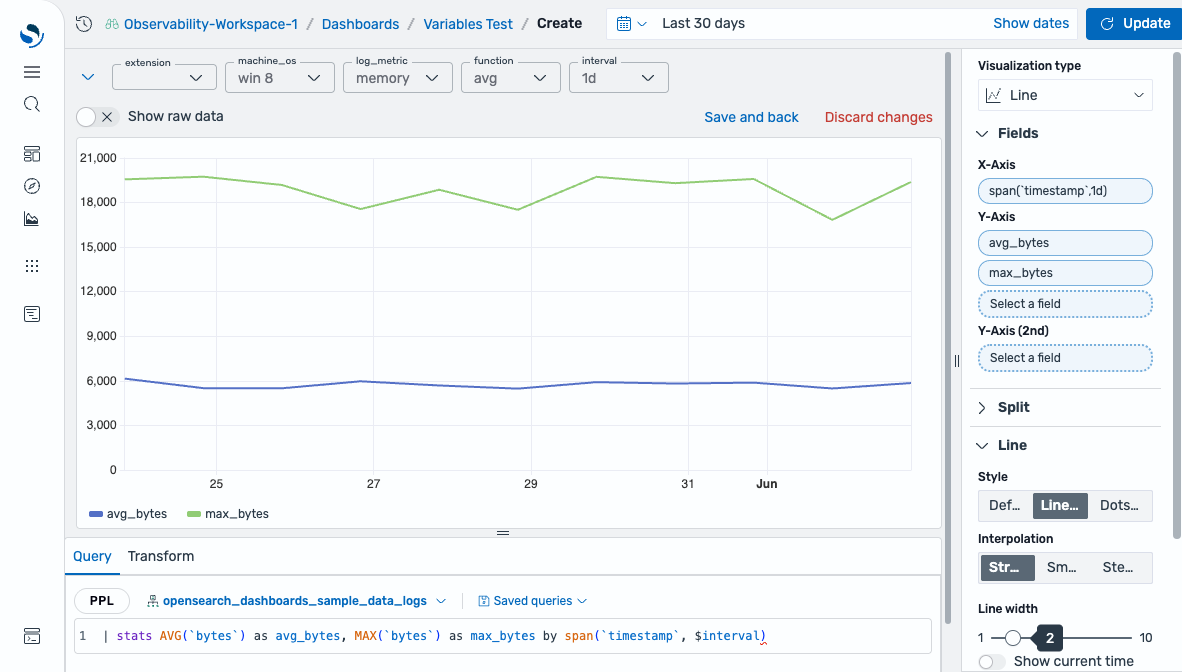
-
Changing aggregation functions dynamically
Section titled “Changing aggregation functions dynamically”Use a variable to let dashboard viewers switch between aggregation functions (for example, avg, max, or min) without editing the query.
To change aggregation functions dynamically, follow these steps:
-
Create a
functionvariable:- Select Dashboards in the left navigation.
- Open an existing dashboard or select Create > Dashboard to create a new dashboard. If creating a new dashboard, save it first by entering a title and selecting Save.
- At the top of the dashboard, select Add variable.
- In the Name, enter
function. In the Type, select Custom. In the Custom options, enteravgand press Enter to add. Repeat formaxandmin. - Select Add variable to save.
-
Use the variable in a visualization:
-
Open a new visualization editor by selecting Create new in the dashboard and then selecting Add visualization.
-
In the time filter, select Last 30 days.
-
In the query box, enter the following query:
| STATS ${function}(memory) BY span(`@timestamp`, 1d)
To switch between functions, select a value in the
functiondropdown list (for example, selectmax) and select Update. The visualization reflects the selected aggregation function, as shown in the following image.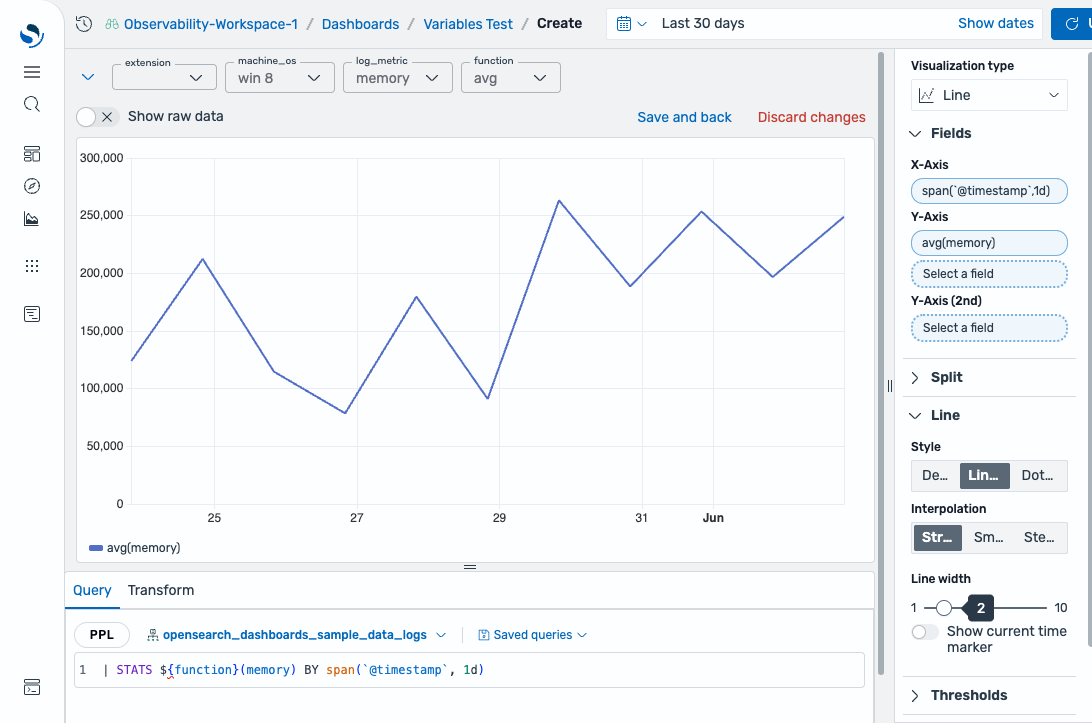
-
Cascading and cross-panel variables
Section titled “Cascading and cross-panel variables”The following sections describe advanced variable use cases.
Cascading variables
Section titled “Cascading variables”Create dependent variables for which one variable filters the options of another. For example, select a region first, then select from services available in that region.
Create a region variable:
source=logs | dedup region | fields regionCreate a service variable that references region:
source=logs | where region='$region' | dedup service | fields serviceWhen the region value changes, the service variable automatically refreshes its options to show only services in the selected region.
Cross-panel filtering
Section titled “Cross-panel filtering”Use a single variable to filter multiple visualizations simultaneously. For example, create a service variable and reference it in multiple visualization editors.
Visualization editor 1 (request count by service):
source=logs | where service='$service' | stats count() by status_codeVisualization editor 2 (response time by service):
source=metrics | where service='$service' | stats avg(response_time)Changing the service variable value updates both visualization editors at once.