Metric chart
A metric chart displays a single numeric value prominently, making it ideal for showing key performance indicators (KPIs) or summary statistics at a glance.
Creating a metric chart
Section titled “Creating a metric chart”The following example demonstrates a basic metric visualization.
Basic metric chart
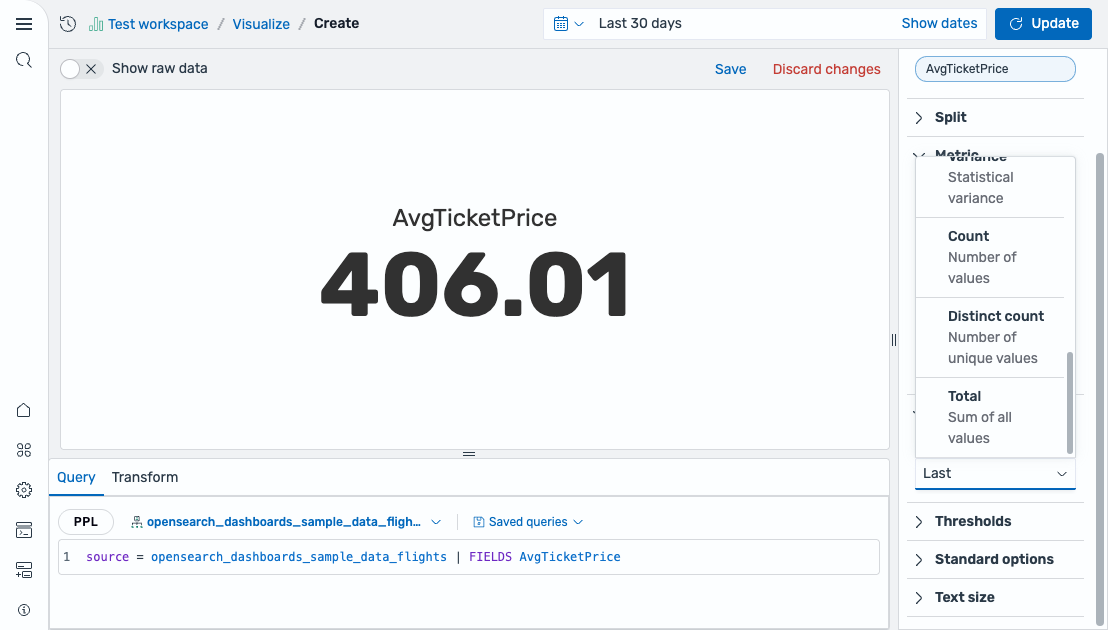
Section titled “Basic metric chart”Start with a query that returns a numeric field:
source = opensearch_dashboards_sample_data_flights | FIELDS AvgTicketPriceAfter running this query, select Metric as the chart type. The editor maps the field as follows:
- The Value field displays the
AvgTicketPricefield (using the Last calculation by default).
The result is a single large number displaying the last ticket price value, as shown in the following image.
Configuring a metric chart
Section titled “Configuring a metric chart”You can configure the following settings in the configuration panel.
Fields
Section titled “Fields”In the Fields section, configure the data fields.
| Field | Description |
|---|---|
| Value | Select a numeric field to display as the metric value. The field is reduced to a single number using the configured calculation method. |
In the Split by dropdown list, select a field to split the chart into separate elements by value. For more information, see Split.
Metric
Section titled “Metric”| Setting | Description |
|---|---|
| Text display | Controls what text is shown alongside the value. Supported values: Value only, Name only, Value and Name, None. |
| Color mode | Controls how threshold colors are applied to the metric. Supported values: None (no color), Value (colors the value text), Background gradient (applies a gradient background), Background solid (applies a solid background color). |
| Show percentage | When enabled, displays the value as a percentage of the max value. |
| Use threshold colors | When enabled, applies threshold colors to the metric based on the current value. |
Value options
Section titled “Value options”| Setting | Description |
|---|---|
| Calculation | Determines how multiple data points are reduced to a single value. Supported values: Last *, Last, First *, First, Min, Max, Median, Variance, Distinct count, Count, Total. For more information, see Value calculations. |
Thresholds
Section titled “Thresholds”For information about configuring thresholds, see Thresholds.
Standard options
Section titled “Standard options”| Setting | Description |
|---|---|
| Min | The lower bound of the metric scale (used for percentage calculations). |
| Max | The upper bound of the metric scale (used for percentage calculations). |
| Units | An optional unit label applied to the displayed value. |
Text size
Section titled “Text size”| Setting | Description |
|---|---|
| Value size | Controls the font size of the displayed value. |
| Title size | Controls the font size of the metric title. |
| Percentage size | Controls the font size of the percentage display (when Show percentage is enabled). |