

Explore Logs
Explore logs is a guided onboarding canvas for the Logs experience (also called the Logs Drilldown). It lets you browse the log data a cluster holds (with a live severity histogram and a preview of the latest raw log lines for each index and dataset) before you write a query. From there you can jump straight into querying an existing dataset, or turn one or more raw indexes into a durable dataset in a few clicks.
Use Explore logs when you know an index exists (for example otel-frontend or nginx-access-logs) but you don’t yet have a dataset to query. It answers “what logs do I have, are they flowing right now, and how do I start?” visually, without writing PPL or building a dataset first.
Prerequisites
Section titled “Prerequisites”Before you can open Explore logs, the following must be true:
- You are inside an observability workspace (one where the Explore experience is enabled).
- When Multiple Data Sources is enabled, at least one OpenSearch data source is registered and associated with the workspace.
Opening Explore logs
Section titled “Opening Explore logs”Explore logs lives alongside the Logs experience. You can reach it from any of these places:
- The Logs navigation popover: In the left navigation, open the Logs popover and select Explore logs.
- The Logs query bar: On the Logs page, select Explore logs at the right of the query bar.
- The Logs empty state: When you open the Logs page without a dataset selected, the empty state offers the Explore logs action alongside Create dataset, so browsing your logs is the suggested first step.

The canvas
Section titled “The canvas”The Explore logs canvas is a full-width vertical stack of cards, one card per dataset and per raw index.
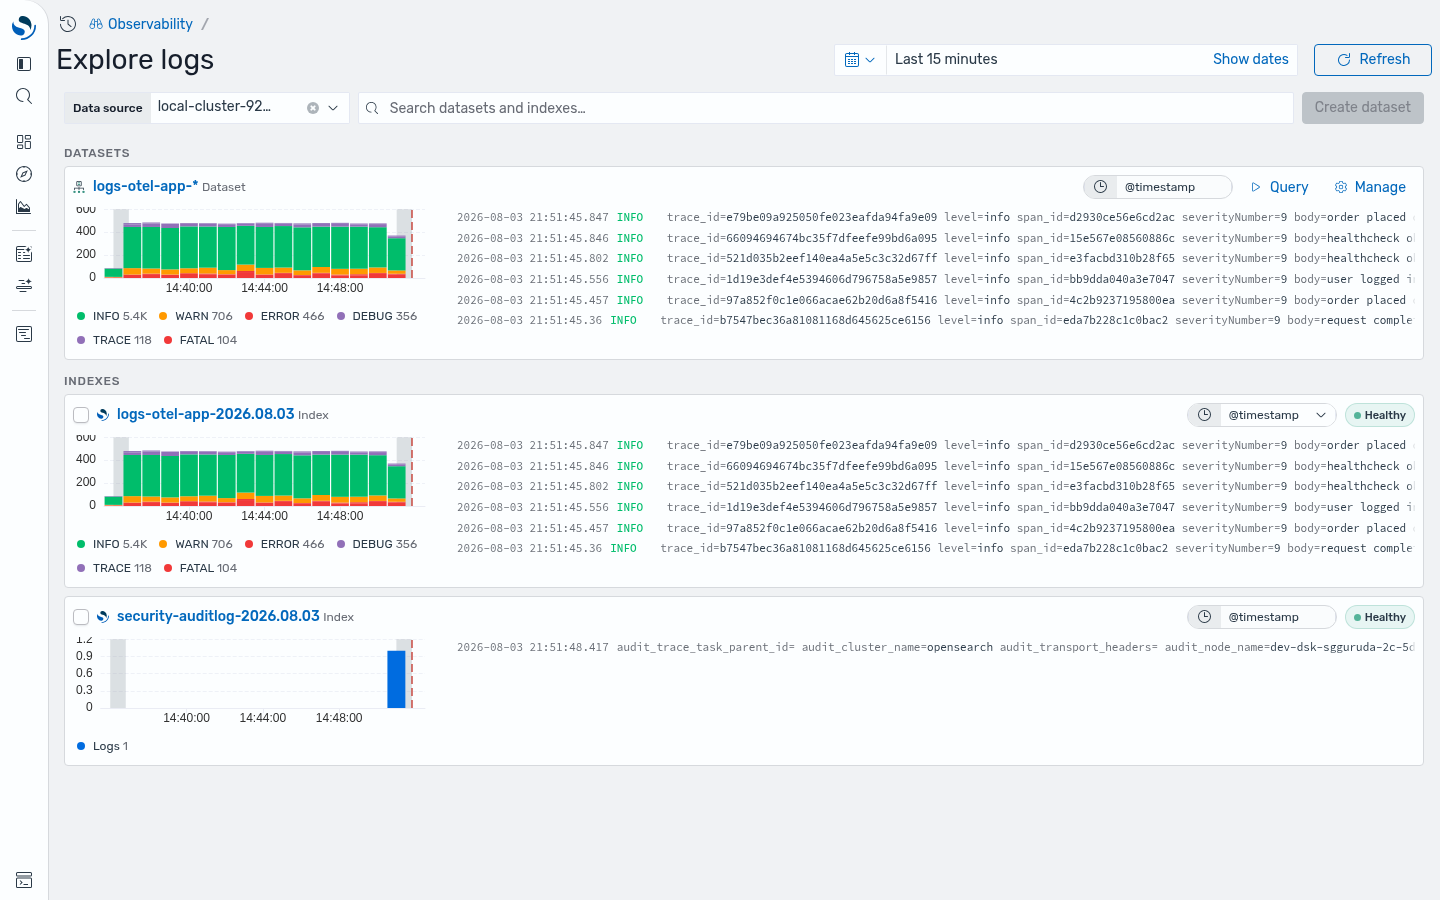
A toolbar runs across the top:
- Data source picker: Scopes the card list to a chosen cluster. Select a data source to see its indexes and datasets.
- Search: Filters both datasets and indexes by name as you type.
- Create dataset: Turns the currently selected indexes into a dataset. The button shows a count, such as Create dataset (2), and is disabled until you select at least one index. If every selected index is already covered by an existing dataset, the button instead reads Query and takes you straight to that dataset.
- Time range: Sets the window used for every card’s histogram and log preview.
Below the toolbar, cards are grouped with Datasets shown first, then Indexes (newest first). The canvas loads the first set of cards and shows a Load more control when more indexes are available.
Reading a card
Section titled “Reading a card”Each card previews one index or dataset at a glance.

A card includes:
- Severity histogram: A stacked bar chart of log volume over the selected time range, colored by severity level (for example, info, warn, error, debug, trace, fatal). A legend below shows humanized per-severity totals. Documents with no recognized severity field are counted as a single logs series.
- Log-line preview: A stream of the latest raw log lines. Each line shows a subdued timestamp, a color-coded level chip, and the remaining fields.
- Time field: The date field used for the histogram and sort. When an index has more than one date field, you can switch it here.
- Index health (indexes only): A pill showing the index status (Healthy, Degraded, or Unhealthy), with store size and shard layout on hover.
- Actions: A dataset card offers Query (jump into the Logs query view) and Manage (open the dataset settings). Selecting an index card’s name starts the Create dataset flow, unless an existing dataset already covers it, in which case it opens that dataset in the Logs query view.
Cards adapt to the state of the underlying data:
| Card state | What it means |
|---|---|
| Full | The index or dataset has documents in the selected time range. Shows the full histogram and log preview. |
| No recent data | Has documents, but none in the selected range. These indexes collapse into a N indexes with no recent data drawer at the bottom; widen the time range to see them. |
| No documents yet | The index has never received a document. Creating a dataset over it is blocked. |
| No time field | The index has no date field, so it can’t be charted or turned into a logs dataset. |
| Couldn’t load preview | The preview query failed. Select Retry to try again. |
Selecting the time range
Section titled “Selecting the time range”The time range defaults to the last 15 minutes so the canvas doesn’t issue heavy queries across every card on load. Adjust it with the time range picker to widen or shift the window. You can also brush-select a region directly on any card’s histogram to set that window as the global time range.
Creating a dataset from indexes
Section titled “Creating a dataset from indexes”Turning raw indexes into a dataset is the core workflow of Explore logs:
-
Select the checkbox on one or more index cards. A selection bar appears below the toolbar showing N index selected, a New dataset label, and the proposed dataset name, with a Clear all action to reset.
-
The selection bar proposes a wildcard dataset name derived from the selected indexes. For example, selecting
security-auditlog-2026.08.03proposessecurity-auditlog-*so the dataset covers the whole family rather than a single day.
-
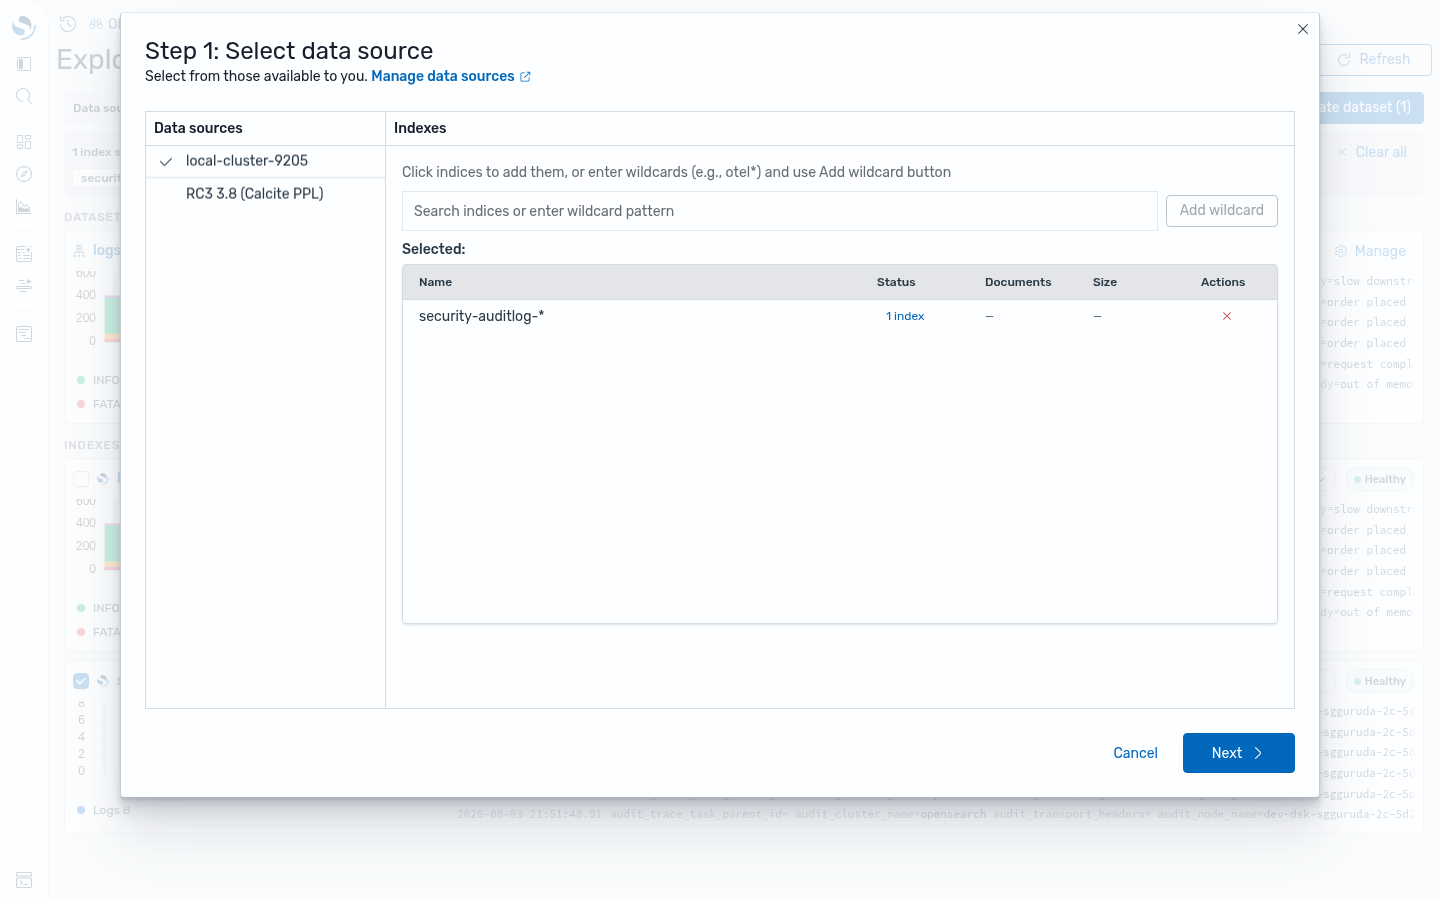
Select Create dataset. A short wizard opens on Step 1: Select data source, pre-seeded with the active data source and the proposed wildcard already in the Selected list. You can add more indexes or wildcard patterns here, then select Next to confirm the time field and remaining settings.
-
Finish the wizard to save the dataset. You land in the Logs query view with the new dataset ready to query.
Querying an existing dataset
Section titled “Querying an existing dataset”Datasets you’ve already created sort to the top of the canvas. Select a dataset card’s name or its Query button to open it directly in the Logs query view, with no dataset creation needed. See Discover Logs for how to query and visualize from there.
Data requirements
Section titled “Data requirements”For an index to appear as a full, chartable card and to become a logs dataset, it needs a date field. Explore logs looks for the following field names, in order, and falls back to the first date field on the index:
@timestamp, time, startTime, endTime, timestamp, observedTimestamp
Severity coloring in the histogram uses the first of these fields that is present, following the OpenTelemetry log record convention:
severityText, severity, level, log.level, severityNumber
If none of these fields is present, the histogram still renders as a single logs series without severity coloring.
Related
Section titled “Related”- Discover Logs: query and visualize logs with PPL.
- Datasets: create and manage datasets.