

Explore an SLO
The SLO detail page is the single screen an on-call engineer opens to answer “are we meeting this objective, and if not, how fast are we burning budget?” Open it from the SLO catalog by clicking an SLO name.
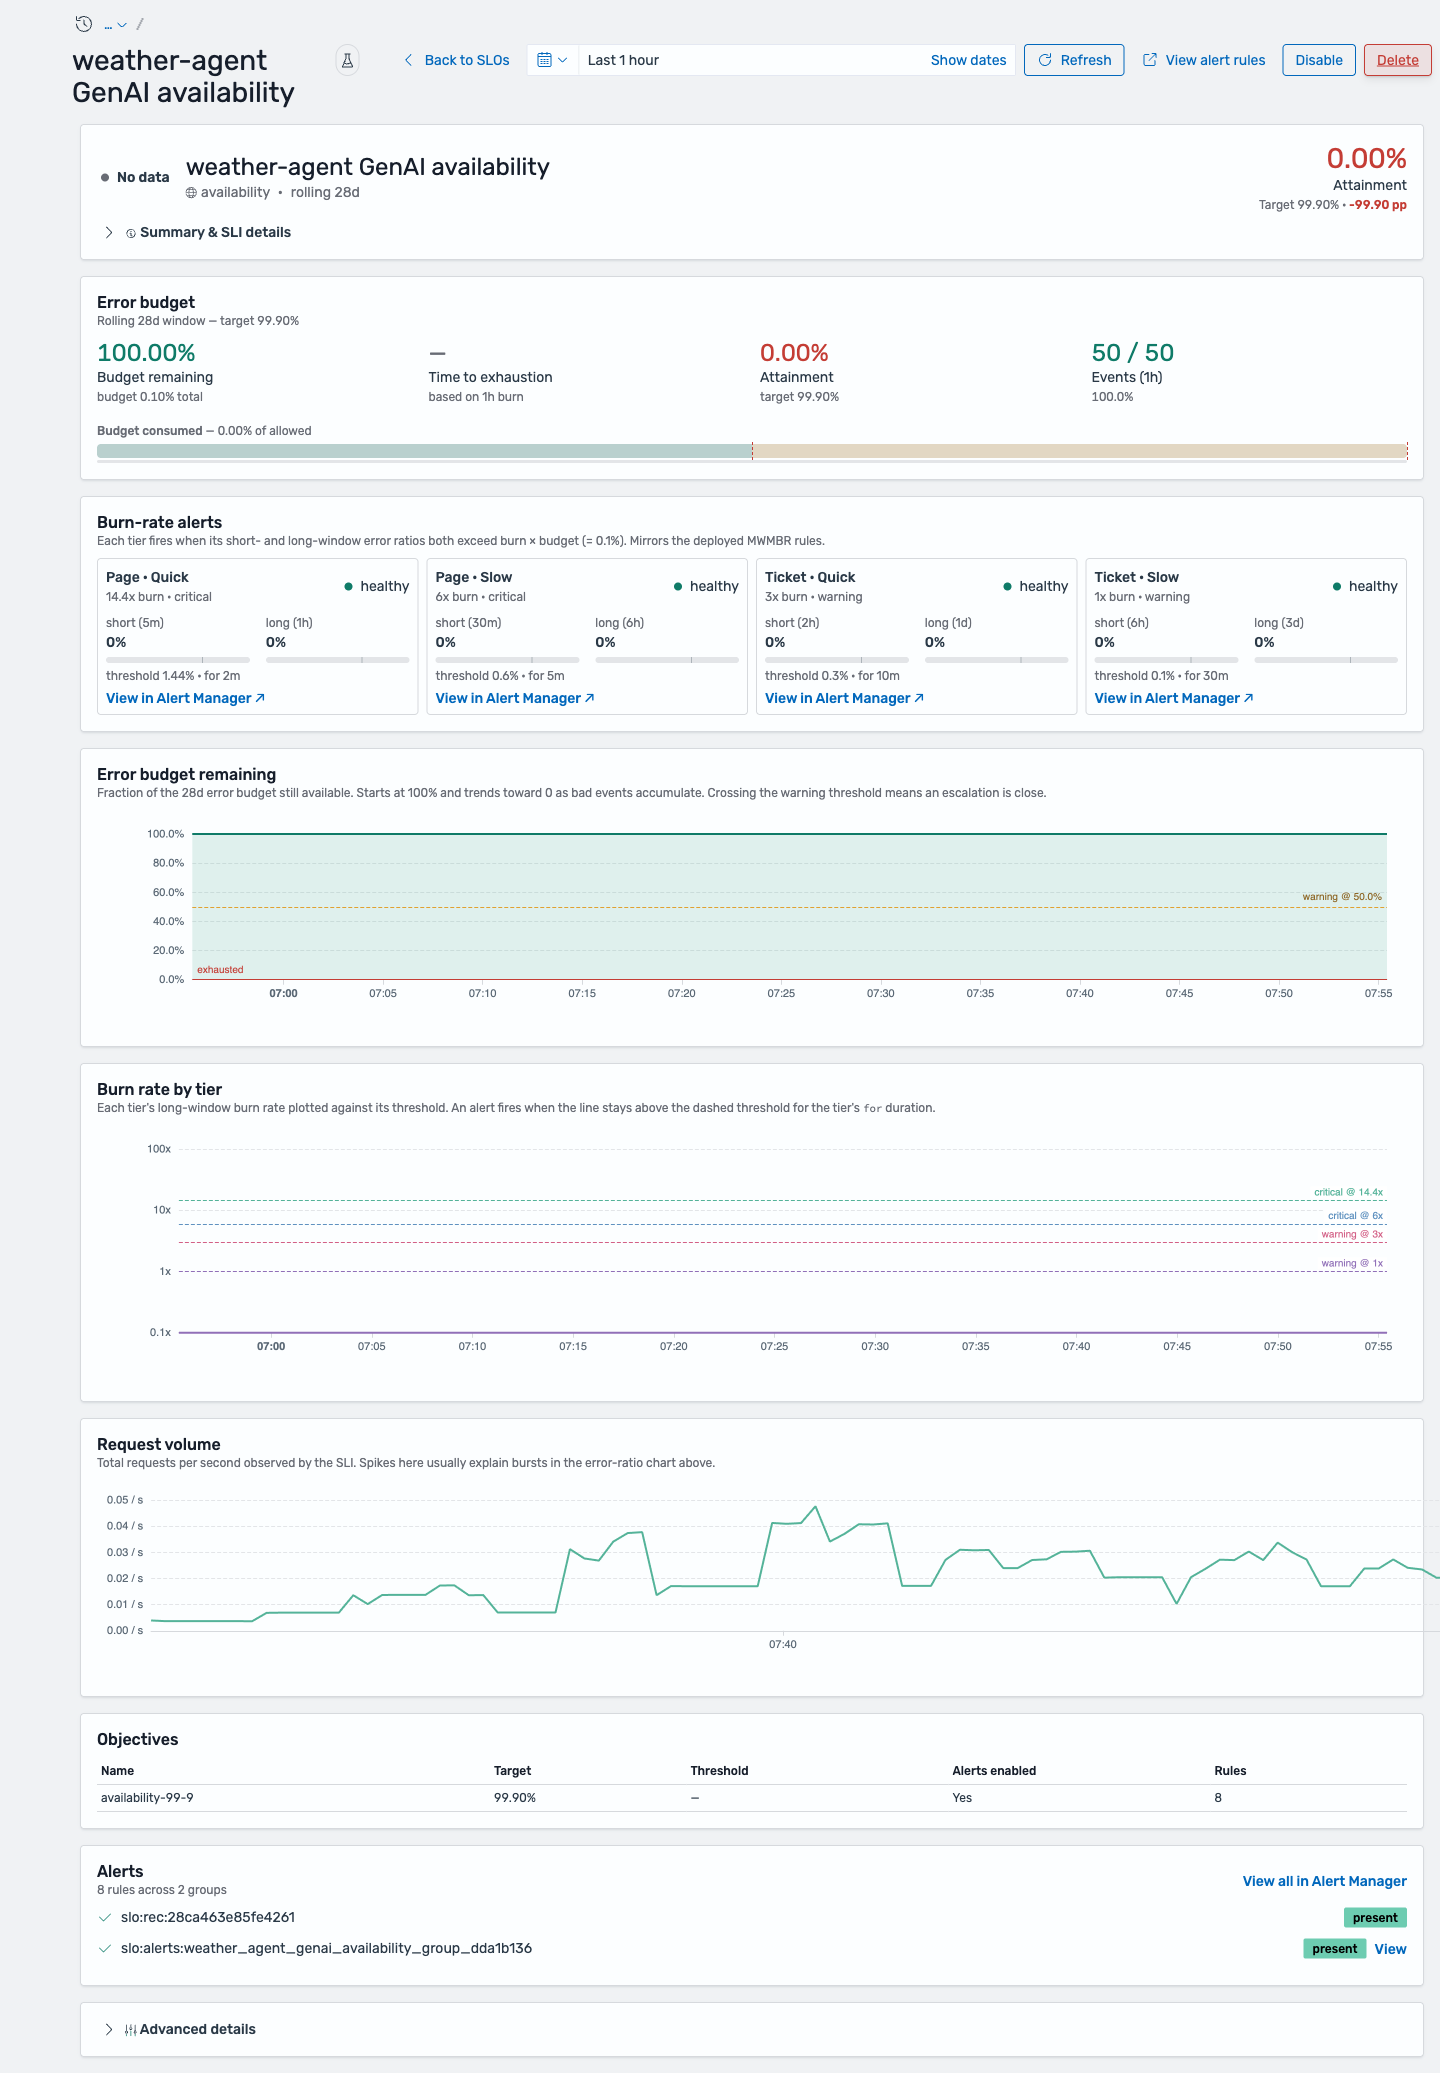
Header
Section titled “Header”The header shows the SLO name, its SLI type and rolling window, and the headline Attainment against the target with the delta in percentage points. A health dot (Healthy / Warning / Breached / No data) summarizes state at a glance. From here you can Refresh, adjust the time range, View alert rules, Disable, or Delete the SLO.
Error budget
Section titled “Error budget”The Error budget panel is the money row:
- Budget remaining — fraction of the allowed error budget still available (starts at 100%).
- Time to exhaustion — projected from the current 1h burn rate.
- Attainment — the SLI value over the window vs. the target.
- Events (1h) — good/total event counts feeding the SLI (e.g.
50 / 50= 100%).
A Budget consumed bar visualizes how much of the allowance has been spent.
Burn-rate alerts
Section titled “Burn-rate alerts”Each card mirrors one deployed MWMBR alert tier and shows its short-window and long-window error ratios against the tier threshold, plus the current status (healthy / firing):
| Tier | Burn | Severity | Windows |
|---|---|---|---|
| Page · Quick | 14.4x | critical | 5m / 1h |
| Page · Slow | 6x | critical | 30m / 6h |
| Ticket · Quick | 3x | warning | 2h / 1d |
| Ticket · Slow | 1x | warning | 6h / 3d |
A tier fires only when both its windows exceed the threshold — the short window catches fast burns quickly, the long window suppresses flapping. View in Alert Manager jumps to the tier’s rule in the Unified Alerts View.
Charts
Section titled “Charts”- Error budget remaining — the budget fraction over time, with the warning threshold (e.g. 50%) and the exhausted line (0%) marked. Crossing the warning line means an escalation is close.
- Burn rate by tier — each tier’s long-window burn rate plotted against its threshold (14.4x / 6x / 3x / 1x). An alert fires when a line stays above its dashed threshold for the tier’s
forduration. - Request volume — total requests/sec observed by the SLI. Spikes here usually explain bursts in the error-ratio chart.
Objectives and generated rules
Section titled “Objectives and generated rules”The Objectives table lists each objective with its target and rule count. The Alerts section confirms the deployed rule groups exist in Prometheus (each marked present). View all in Alert Manager opens them in the Unified Alerts View.
When it says “No data”
Section titled “When it says “No data””If charts show SLI source metric not found in this datasource, the SLI is querying a metric name or label set the datasource has never scraped — waiting won’t help. Common causes:
- The SLI targets span-derived metrics (
request/faultwithnamespace="span_derived") but that service isn’t currently emitting traces through Data Prepper. - A dimension selector (e.g.
service_name="…") doesn’t match any live series.
Re-check the SLI’s metric and selectors, or point the SLO at a datasource that has the data. Use Probe SLI in the create wizard to validate queries before creating an SLO.