

Create an SLO
Creating an SLO starts from a template and ends with a deployed Prometheus rule group. The wizard fills in the PromQL for you based on the metric family you pick, and shows a live preview of exactly what will be deployed before you commit.
Open the SLO app (SLOs in the side navigation, under Application Performance) and click Create SLO.
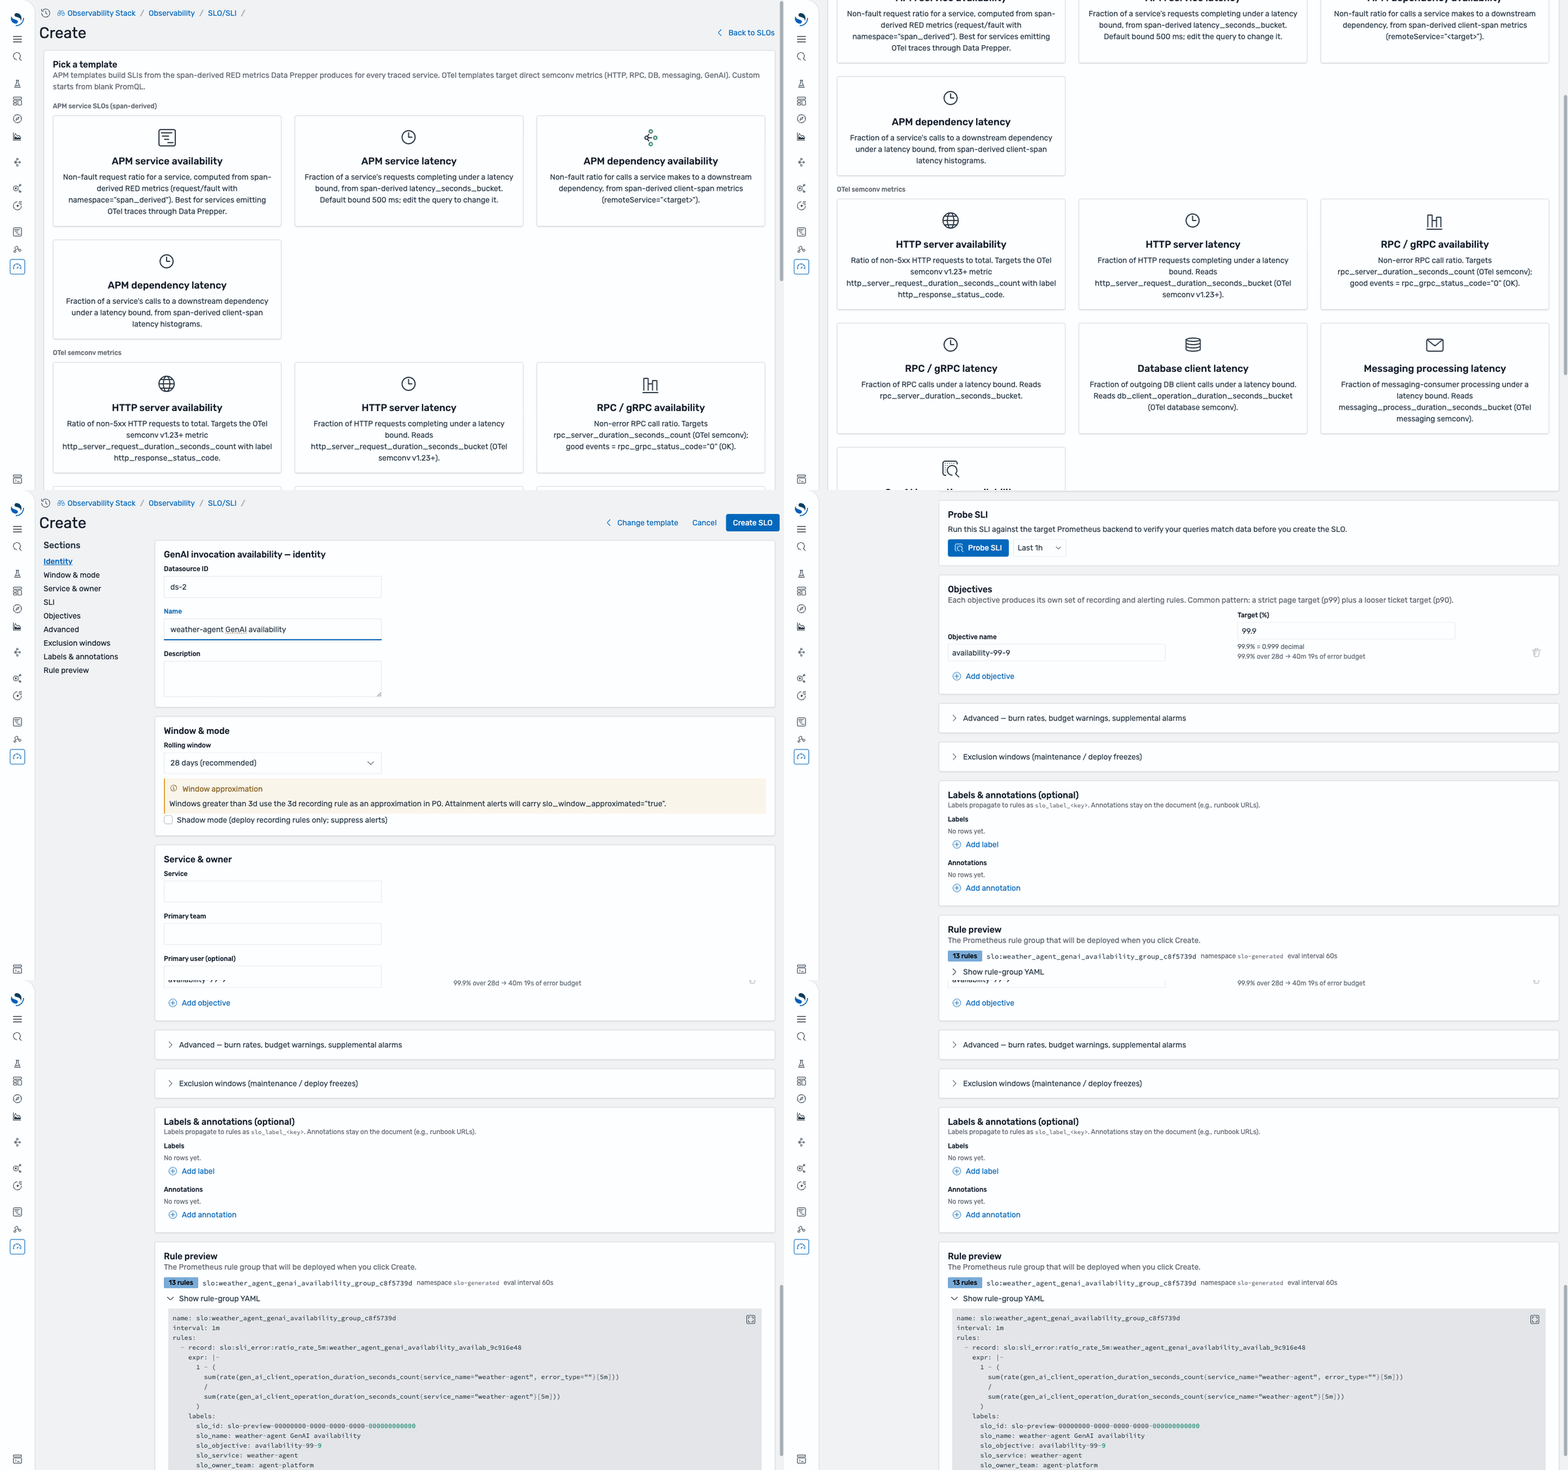
Pick a template, fill in identity and objectives, and watch the Prometheus rule group preview build in real time.
Step 1 — Pick a template
Section titled “Step 1 — Pick a template”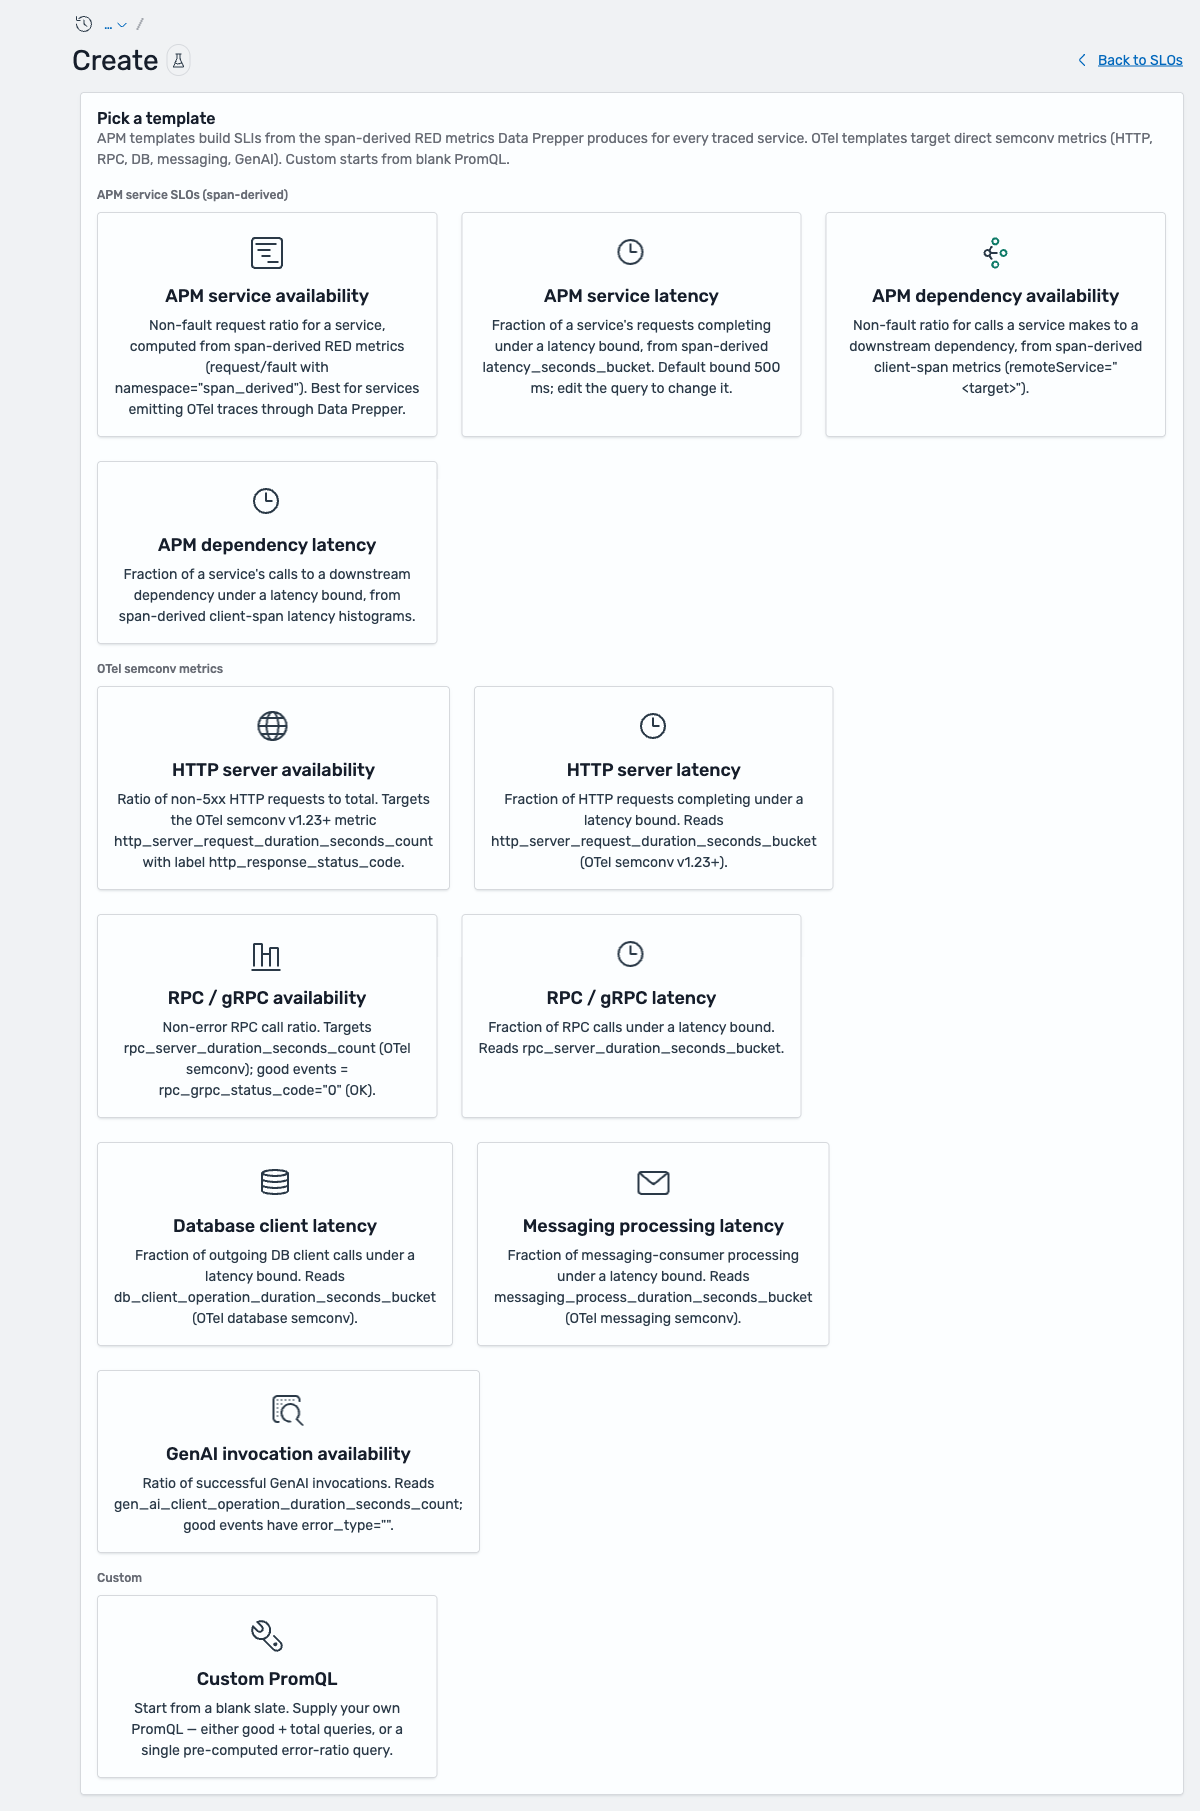
Templates are grouped by the metric family they read:
APM service SLOs (span-derived) — built from the RED metrics Data Prepper derives from spans for every traced service (request / fault / latency_seconds_bucket with namespace="span_derived").
- APM service availability — non-fault request ratio for a service.
- APM service latency — fraction of requests under a latency bound (default 500 ms).
- APM dependency availability — non-fault ratio for calls a service makes to a downstream dependency.
- APM dependency latency — fraction of those dependency calls under a latency bound.
OTel semconv metrics — target OpenTelemetry semantic-convention metrics directly.
- HTTP server availability / latency — from
http_server_request_duration_seconds_*(semconv v1.23+). - RPC / gRPC availability / latency — from
rpc_server_duration_seconds_*. - Database client latency — from
db_client_operation_duration_seconds_bucket. - Messaging processing latency — from
messaging_process_duration_seconds_bucket. - GenAI invocation availability — from
gen_ai_client_operation_duration_seconds_count; good events haveerror_type="".
Custom — Custom PromQL starts from a blank slate: supply your own good + total queries, or a single pre-computed error-ratio query.
Step 2 — Fill in the wizard
Section titled “Step 2 — Fill in the wizard”The wizard is a single scrollable form with a section jump-nav on the left.
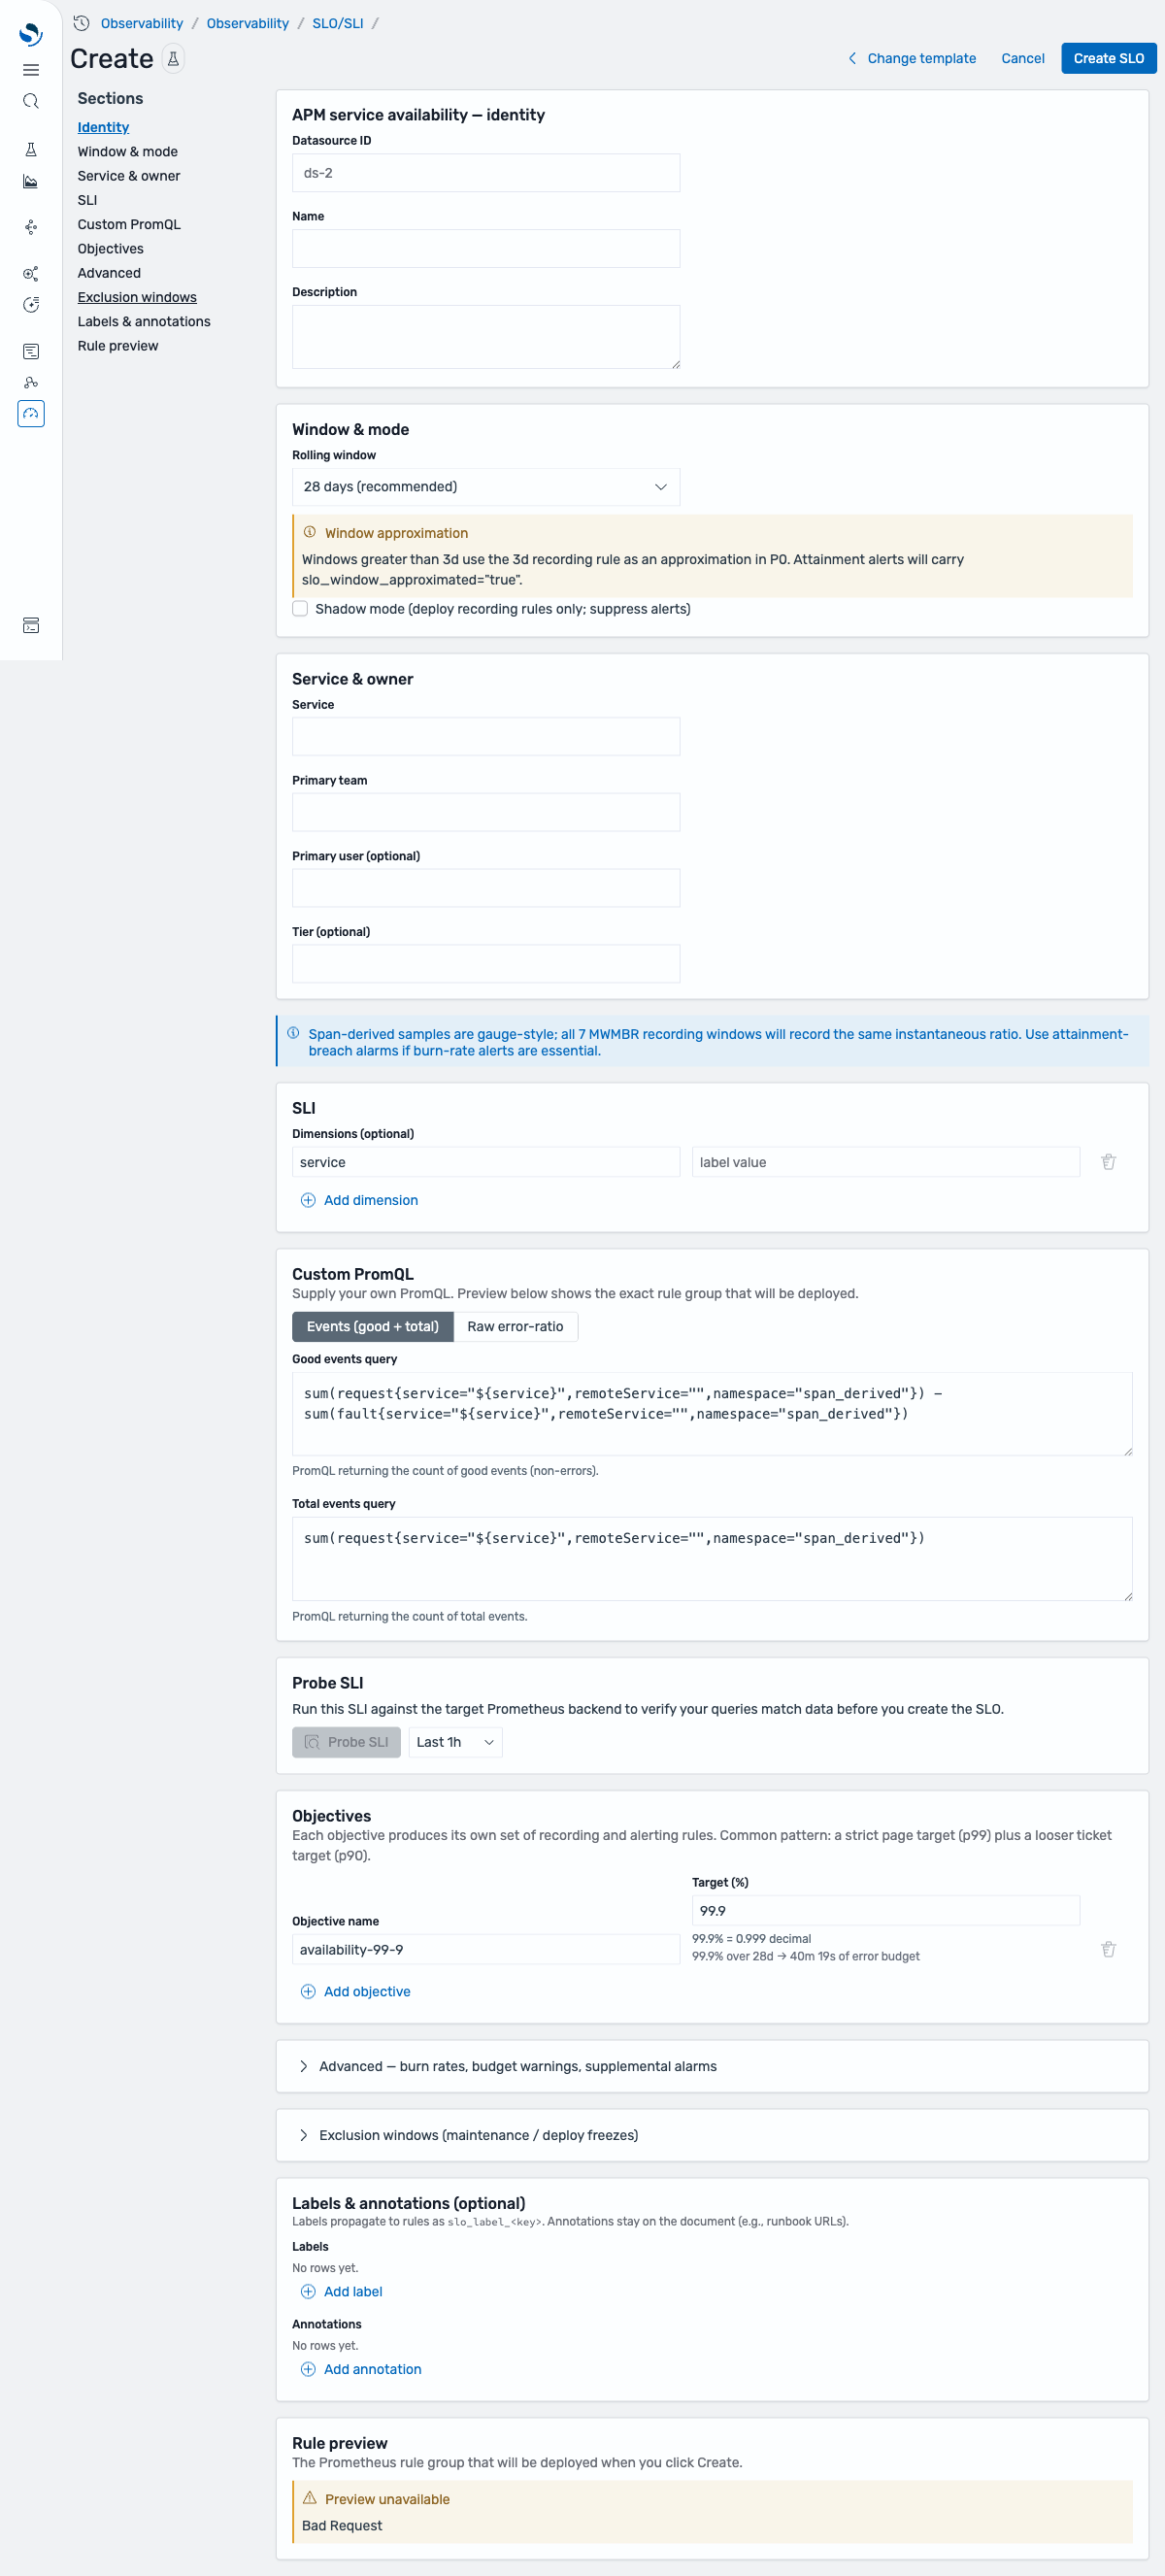
| Section | What to set |
|---|---|
| Identity | The Prometheus datasource to target, a Name, and an optional description. |
| Window & mode | Rolling window — 7 / 14 / 28 (recommended) / 30 days. Optionally enable Shadow mode to deploy recording rules only and suppress alerts while you validate. |
| Service & owner | Service name, primary team, optional primary user and tier. These become filter facets in the catalog and labels on the rules. |
| SLI | Template-specific. For availability templates, a good-events filter (e.g. error_type="") and optional dimensions (label selectors like service_name="weather-agent"). |
| Objectives | One or more targets, each producing its own rule set. The field shows the equivalent decimal and the resulting error budget as a duration (e.g. 99.9% over 28d → 40m 19s). |
| Advanced | Burn-rate multipliers, budget-warning thresholds, and supplemental alarm severities. |
| Exclusion windows | Maintenance / deploy-freeze windows to exclude from budget accounting. |
| Labels & annotations | Labels propagate to rules as slo_label_<key>; annotations (e.g. runbook URLs) stay on the SLO document. |
Probe the SLI before you commit
Section titled “Probe the SLI before you commit”The Probe SLI button runs the SLI’s good and total queries against the target Prometheus backend over a 1h / 24h / 7d lookback and reports the Good, Total, and SLI ratio it found. If it returns zero, the SLO would show no_data — a signal to re-check your metric name, filter, or dimensions before creating it.
Step 3 — Review the rule preview
Section titled “Step 3 — Review the rule preview”Before you commit, the Rule preview shows the exact Prometheus rule group that will be deployed — its name, the slo-generated namespace, the 60s evaluation interval, and the rule count. Click Show rule-group YAML if you want to read the generated recording and burn-rate rules line by line; you don’t need to, but nothing is hidden.
Step 4 — Create
Section titled “Step 4 — Create”Click Create SLO. The rule group deploys to Prometheus and you land on the SLO detail page. Recording rules evaluate on a short interval, so charts populate within a minute or two; until the first samples arrive the SLO shows no_data.