Scatter plot
A scatter chart visualizes relationships between two numerical variables. Each point on the chart represents an observation from the dataset, with its position determined by the values of the two variables. You can split data by a categorical field to compare how different groups distribute across the same dimensions.
Creating a scatter chart
Section titled “Creating a scatter chart”The following examples build on each other, starting with a basic two-variable scatter and adding dimensions.
Basic scatter chart
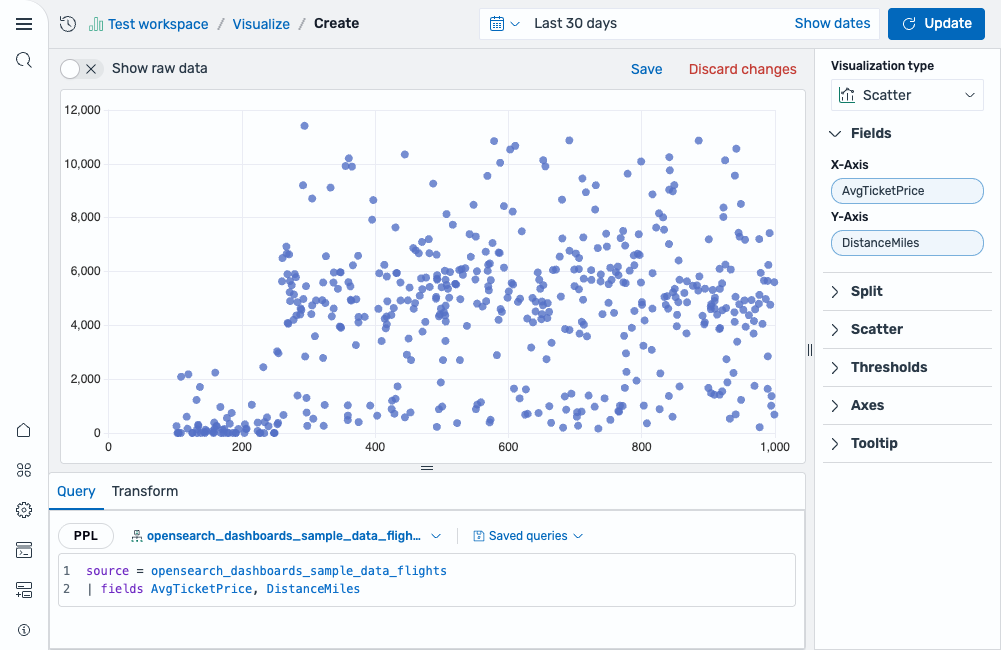
Section titled “Basic scatter chart”Start with a query that returns two numeric fields:
source = opensearch_dashboards_sample_data_flights | fields AvgTicketPrice, DistanceMilesAfter running this query, select Scatter as the chart type. The fields are mapped as follows:
- The X-Axis displays the
AvgTicketPricefield. - The Y-Axis displays the
DistanceMilesfield.
The result is a scatter plot showing the relationship between ticket price and flight distance. Each point represents a single flight, as shown in the following image.
Using thresholds
Section titled “Using thresholds”To apply thresholds, enable Use threshold colors in the Scatter section. Then open the Thresholds section and add a threshold of 6000 to highlight long-distance flights, as shown in the following image.
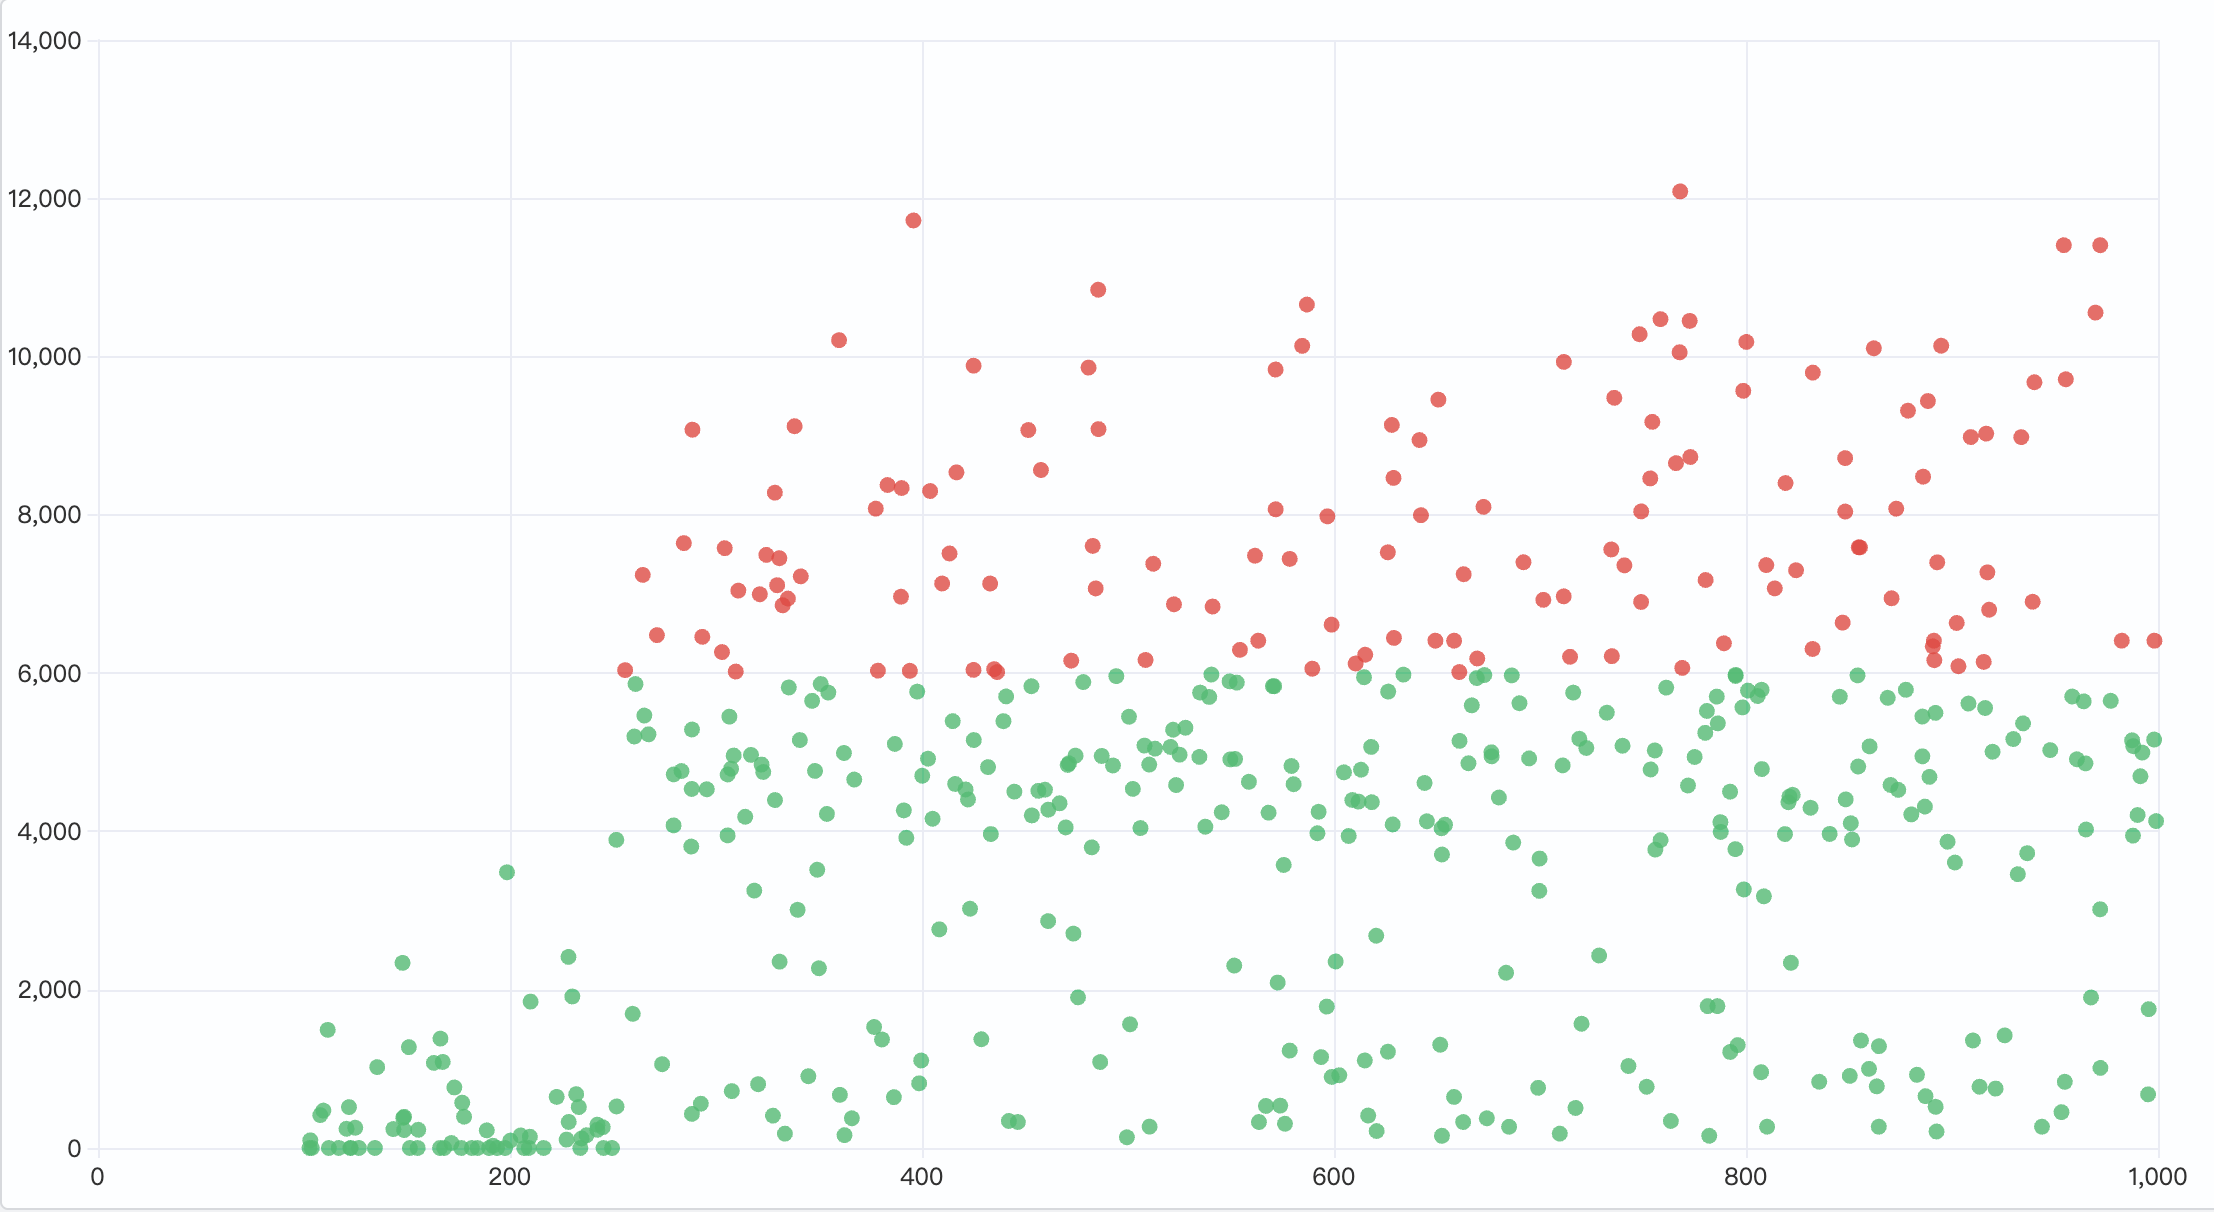
For more information, see Thresholds.
Adding a color dimension
Section titled “Adding a color dimension”Add a categorical field to split the data points into color-coded groups:
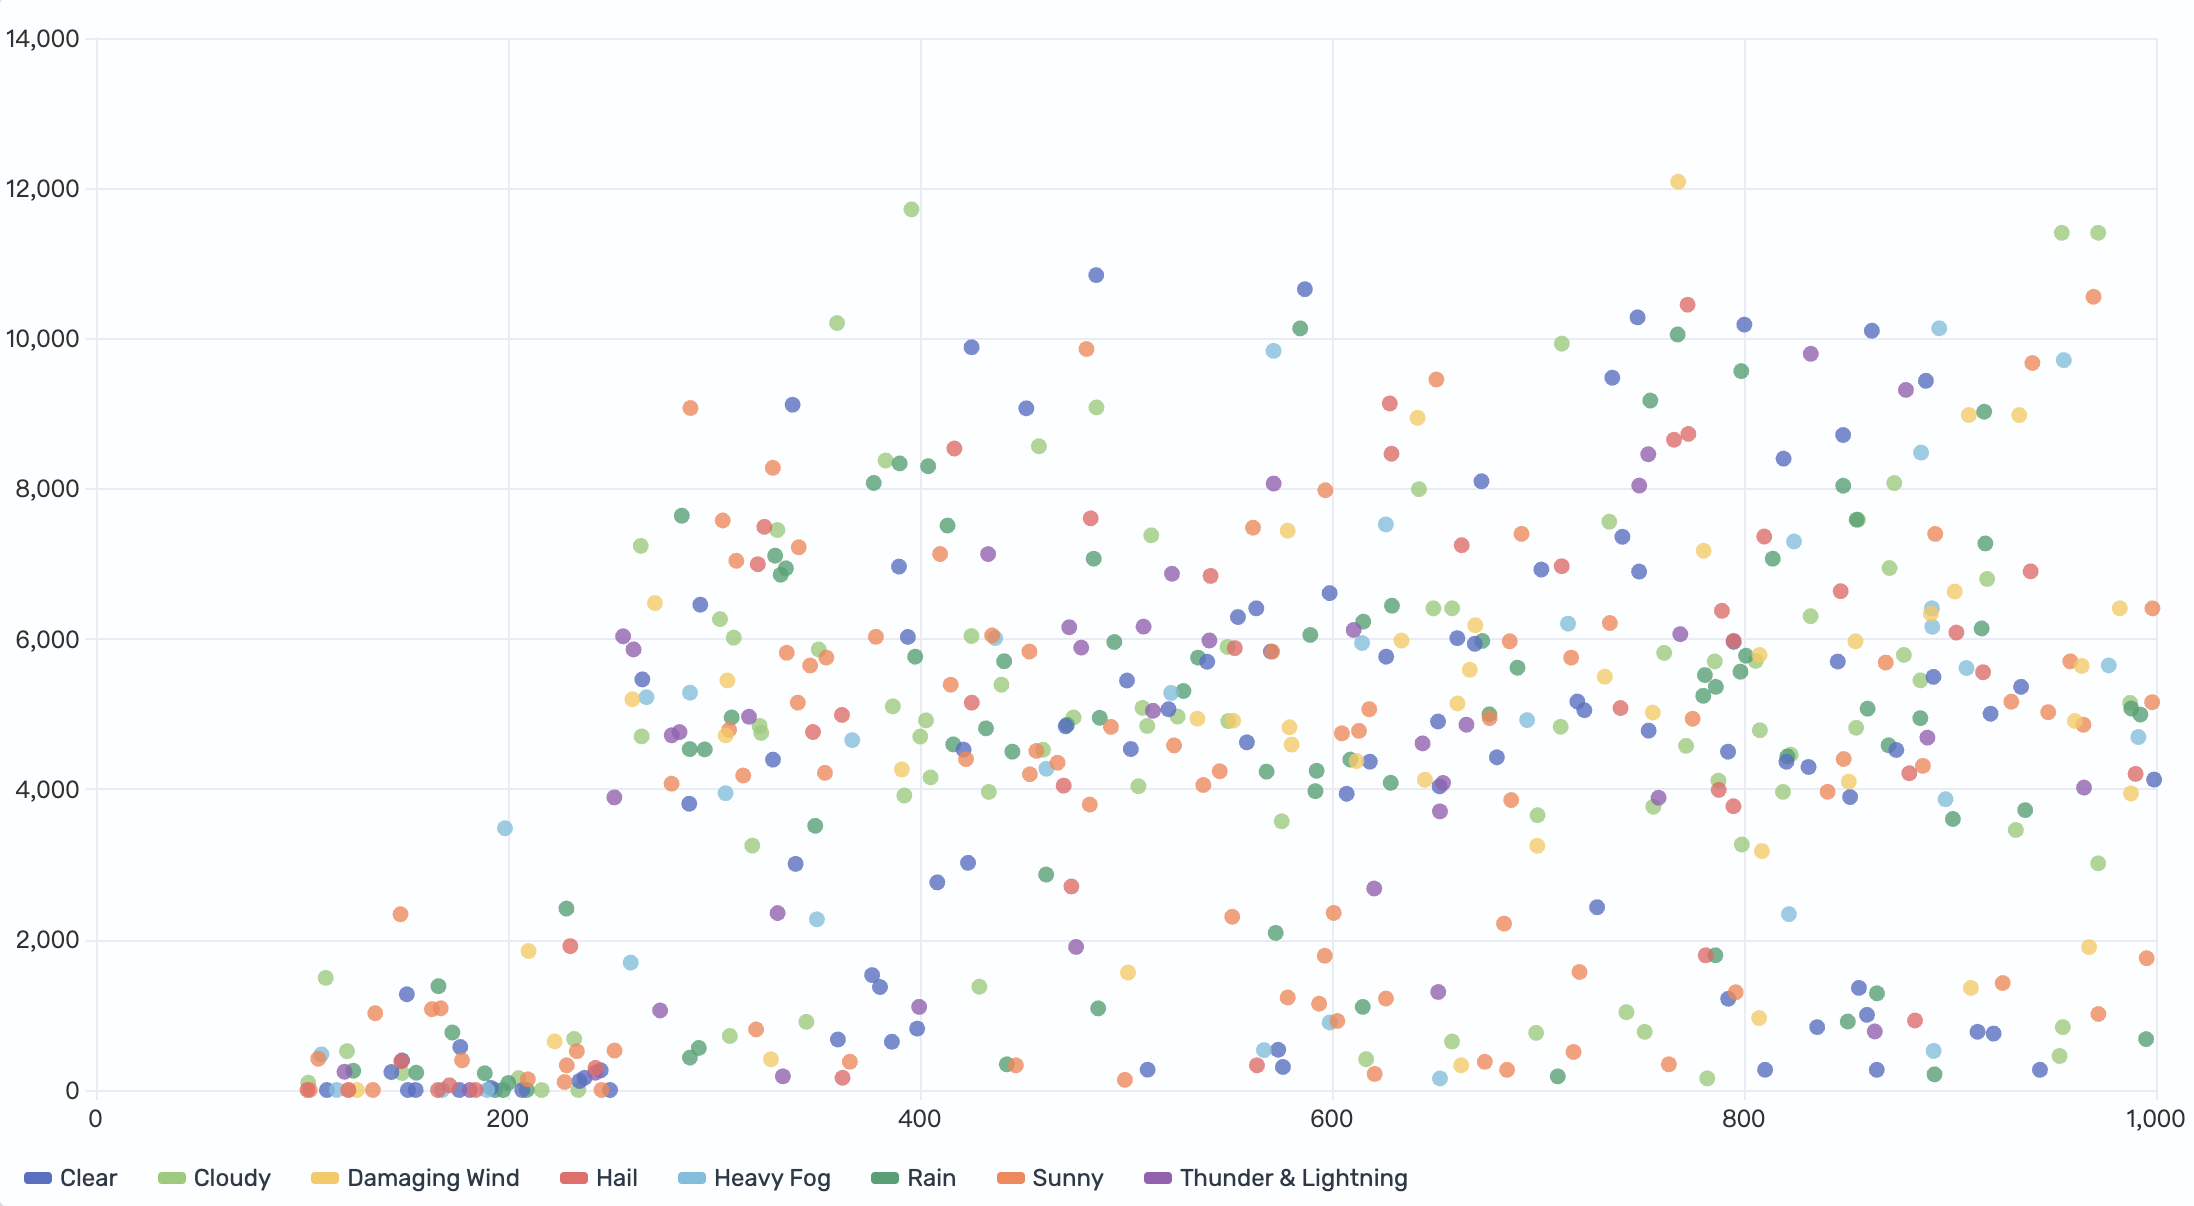
source = opensearch_dashboards_sample_data_flights | fields AvgTicketPrice, DistanceMiles, DestWeatherThis query returns two numeric fields: AvgTicketPrice and DistanceMiles. Select DestWeather as the Color field.
The result is a scatter plot with points split into color-coded groups---each weather condition is rendered in a distinct color, as shown in the following image.
Adding a size dimension
Section titled “Adding a size dimension”Add a third numeric field to control point size, creating a bubble chart:
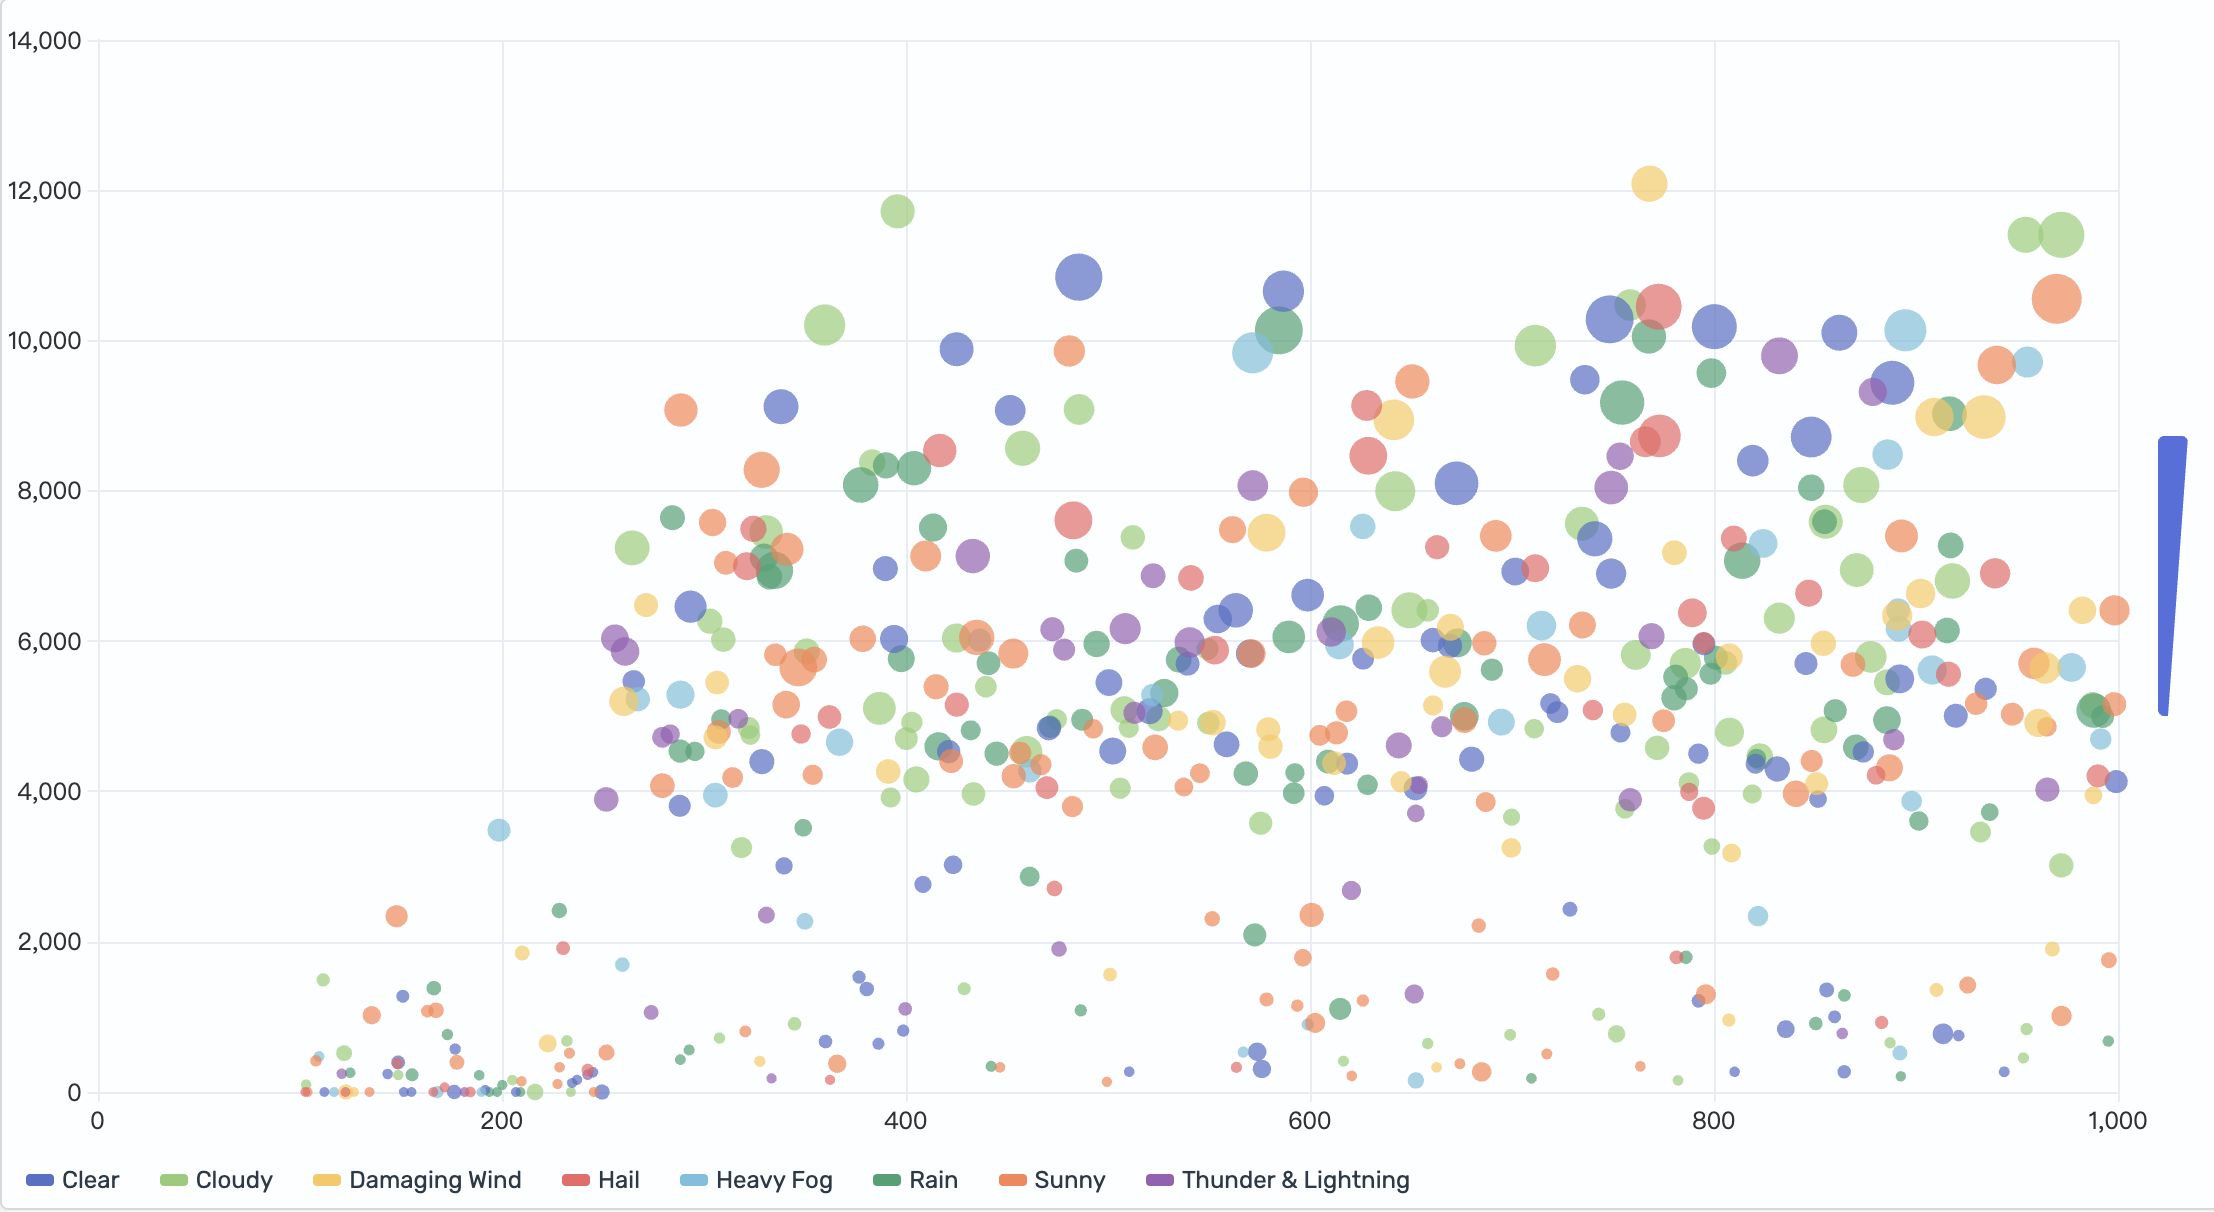
source = opensearch_dashboards_sample_data_flights | fields AvgTicketPrice, DistanceMiles, DestWeather, FlightDelayMinThis query returns three numeric fields: AvgTicketPrice, DistanceMiles, and FlightDelayMin. Select DestWeather as the Color field and map FlightDelayMin to the Size field.
Points now vary in size---larger bubbles represent longer delays. Each color still represents a weather condition, making it possible to identify whether certain weather types correlate with both higher prices and longer delays, as shown in the following image.
Configuring a scatter chart
Section titled “Configuring a scatter chart”You can configure the following settings in the configuration panel.
Fields
Section titled “Fields”In the Fields section, configure the fields displayed on each axis.
| Configuration | Fields | Description |
|---|---|---|
| Two numerical | X-Axis (numeric), Y-Axis (numeric) | Select two numeric fields to display data points showing the relationship between two numerical variables. |
| Two numerical + one categorical | X-Axis (numeric), Y-Axis (numeric), Color (categorical) | Select two numeric fields and a categorical Color field to display data points split into color-coded groups. |
| Three numerical + one categorical | X-Axis (numeric), Y-Axis (numeric), Size (numeric), Color (categorical) | Select three numeric fields and a categorical Color field to display data points with colors indicating categories and the third numeric field controlling the size of the points. |
In the Split by dropdown list, select a field to split the chart into separate elements by value. For more information, see Split.
Scatter
Section titled “Scatter”Use the following settings to customize the appearance and behavior of the scatter chart.
| Setting | Description |
|---|---|
| Point size | Controls the default size of data points when no Size field is mapped. |
| Shape | Controls the shape of each data point. Supported values: Circle, Square, Diamond, Cross. |
| Filled | When enabled, data points are filled with color. When disabled, only the outline is rendered. |
| Angle | Controls the display angle of each data point in degrees. Supports values in the 0–360 range. |
Thresholds
Section titled “Thresholds”For information about configuring thresholds, see Thresholds.
The X-axis and Y-axis share the same configuration options. For more information, see Axes.
Legend
Section titled “Legend”The legend summarizes the visual color encodings used in the chart.
| Setting | Description |
|---|---|
| Show legend | Shows or hides the legend. |
| Position | Controls where the legend appears relative to the chart. Supported values: Left, Right, Top, Bottom. |
Tooltip
Section titled “Tooltip”Toggle the Show tooltip selector to enable or disable tooltips.