

Unified Alerts View
The Unified Alerts View (labeled Alerts in the OpenSearch Dashboards side navigation) brings alerting, anomaly detection, and forecasting into one experience. Use it to create and manage alert rules, anomaly detectors, and forecasters, and to investigate alerts and detected anomalies without switching between plugin dashboards.
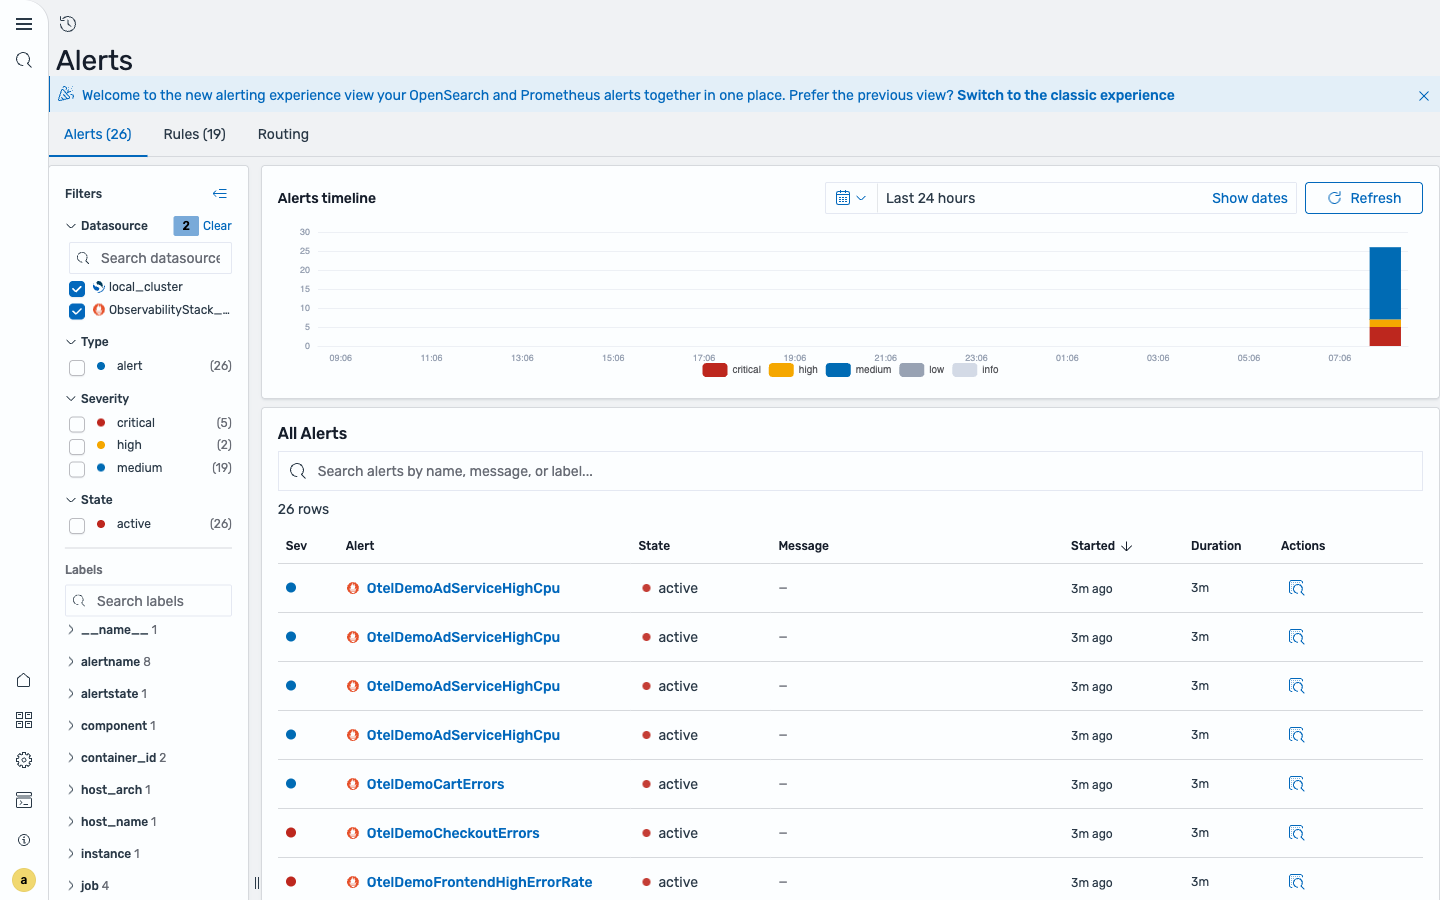
The three tabs
Section titled “The three tabs”| Tab | What it shows | Where to read more |
|---|---|---|
| Alerts | Currently firing and historical alerts, where available, plus anomaly results across the selected data sources. | Explore Alerts |
| Rules | Alerting rules, anomaly detectors, and forecasters, with their current status, type, health, and data source. Also where you create and manage them. | Create Rules · Explore Rules |
| Routing | The Prometheus Alertmanager routing tree — which receiver each metric alert is sent to. | Routing |
Resource types
Section titled “Resource types”The Rules tab lists alerting rules and machine-learning resources side by side. The Type facet identifies how each resource evaluates data:
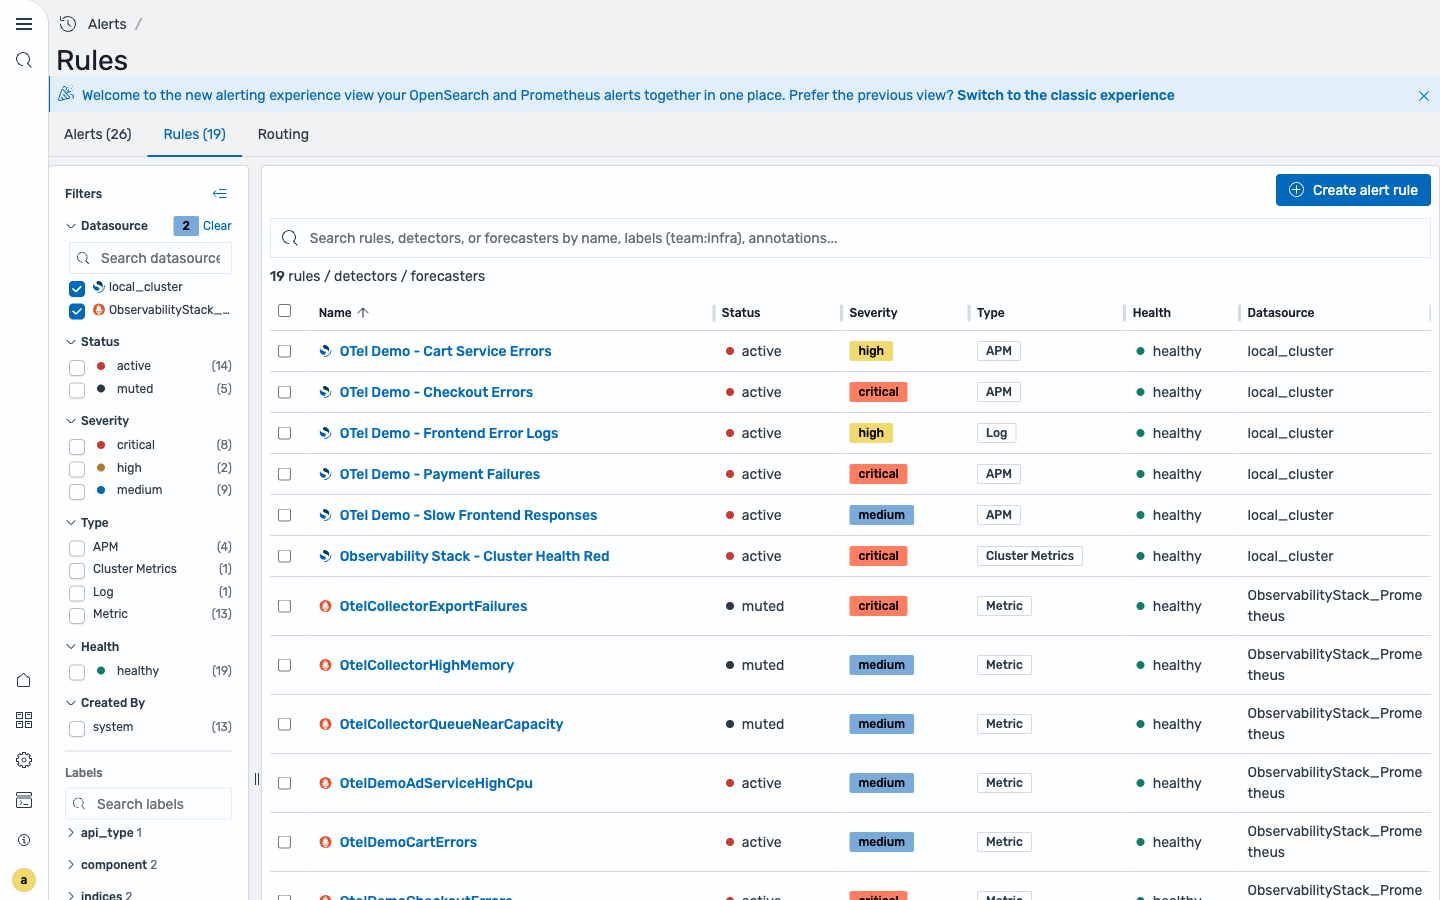
| Type | Purpose | Defined with |
|---|---|---|
| Log | Alert on logs and traces in OpenSearch indices | PPL |
| Metric | Alert on Prometheus time series | PromQL |
| Anomaly Detector | Learn normal behavior and identify unusual values in OpenSearch time-series data | One or more aggregation features |
| Forecaster | Predict future values from OpenSearch time-series data | An indicator, forecast interval, and horizon |
| APM | Alert on trace and span data (classic monitors) | Query DSL |
| Cluster Metrics | Alert on OpenSearch cluster health (classic monitors) | API calls |
The Create menu builds log rules, metric rules, anomaly detection rules, and forecasting rules. See Create Rules for each workflow. APM and Cluster Metrics rules also appear here but are classic monitors created in the standalone Alerting app.
Anomaly detector results appear as anomalies in the Alerts tab. Forecasters do not create alert rows by themselves; use the Rules tab to check their runtime status and inspect their configuration. For more background on the models, see Anomaly Detection and Forecasting.
In this section
Section titled “In this section”Classic monitors (previous experience)
Section titled “Classic monitors (previous experience)”The Unified Alerts View is the new, default alerting experience. The standalone Alerting app continues to provide classic monitor workflows that are not available in the unified creation forms.
The classic app offers monitor types that the log-rule form doesn’t cover, defined with a visual editor or an extraction (query DSL) query rather than PPL:
| Classic type | Best for | Modern equivalent |
|---|---|---|
| Per-query | A single threshold check on aggregation results | Log rule: stats + custom condition |
| Per-bucket | One alert per group (e.g. per service) | Log rule: stats ... by <field> + custom condition |
| Per-document | Alerting on individual matching documents, with findings | — (use classic) |
| Per-cluster metrics | Watching OpenSearch cluster health via API calls | — (use classic) |
| Composite | Chaining monitors with workflow logic to reduce noise | — (use classic) |
For most observability use cases a PPL log rule is faster to write and read than a per-query or per-bucket monitor. Reach for the classic app when you need per-document, per-cluster metrics, or composite monitors. Rules created either way surface together in this view, tagged by type. For the full classic reference, see the OpenSearch Alerting documentation.
Related
Section titled “Related”- Alerting Overview — how log rules and metric rules fit together.
- SLOs — SLO burn-rate alerts surface here as metric rules.
- PPL — Query Language — the language behind log rules.