

Routing
The Routing tab of the Unified Alerts View is a read-only view of the Prometheus Alertmanager definition: which receiver gets which alerts, the grouping and timing settings, and the configured receivers (webhook, Slack, email, PagerDuty). It renders the current routing for the selected Prometheus data source, so you can confirm what’s in effect without reading the config file.
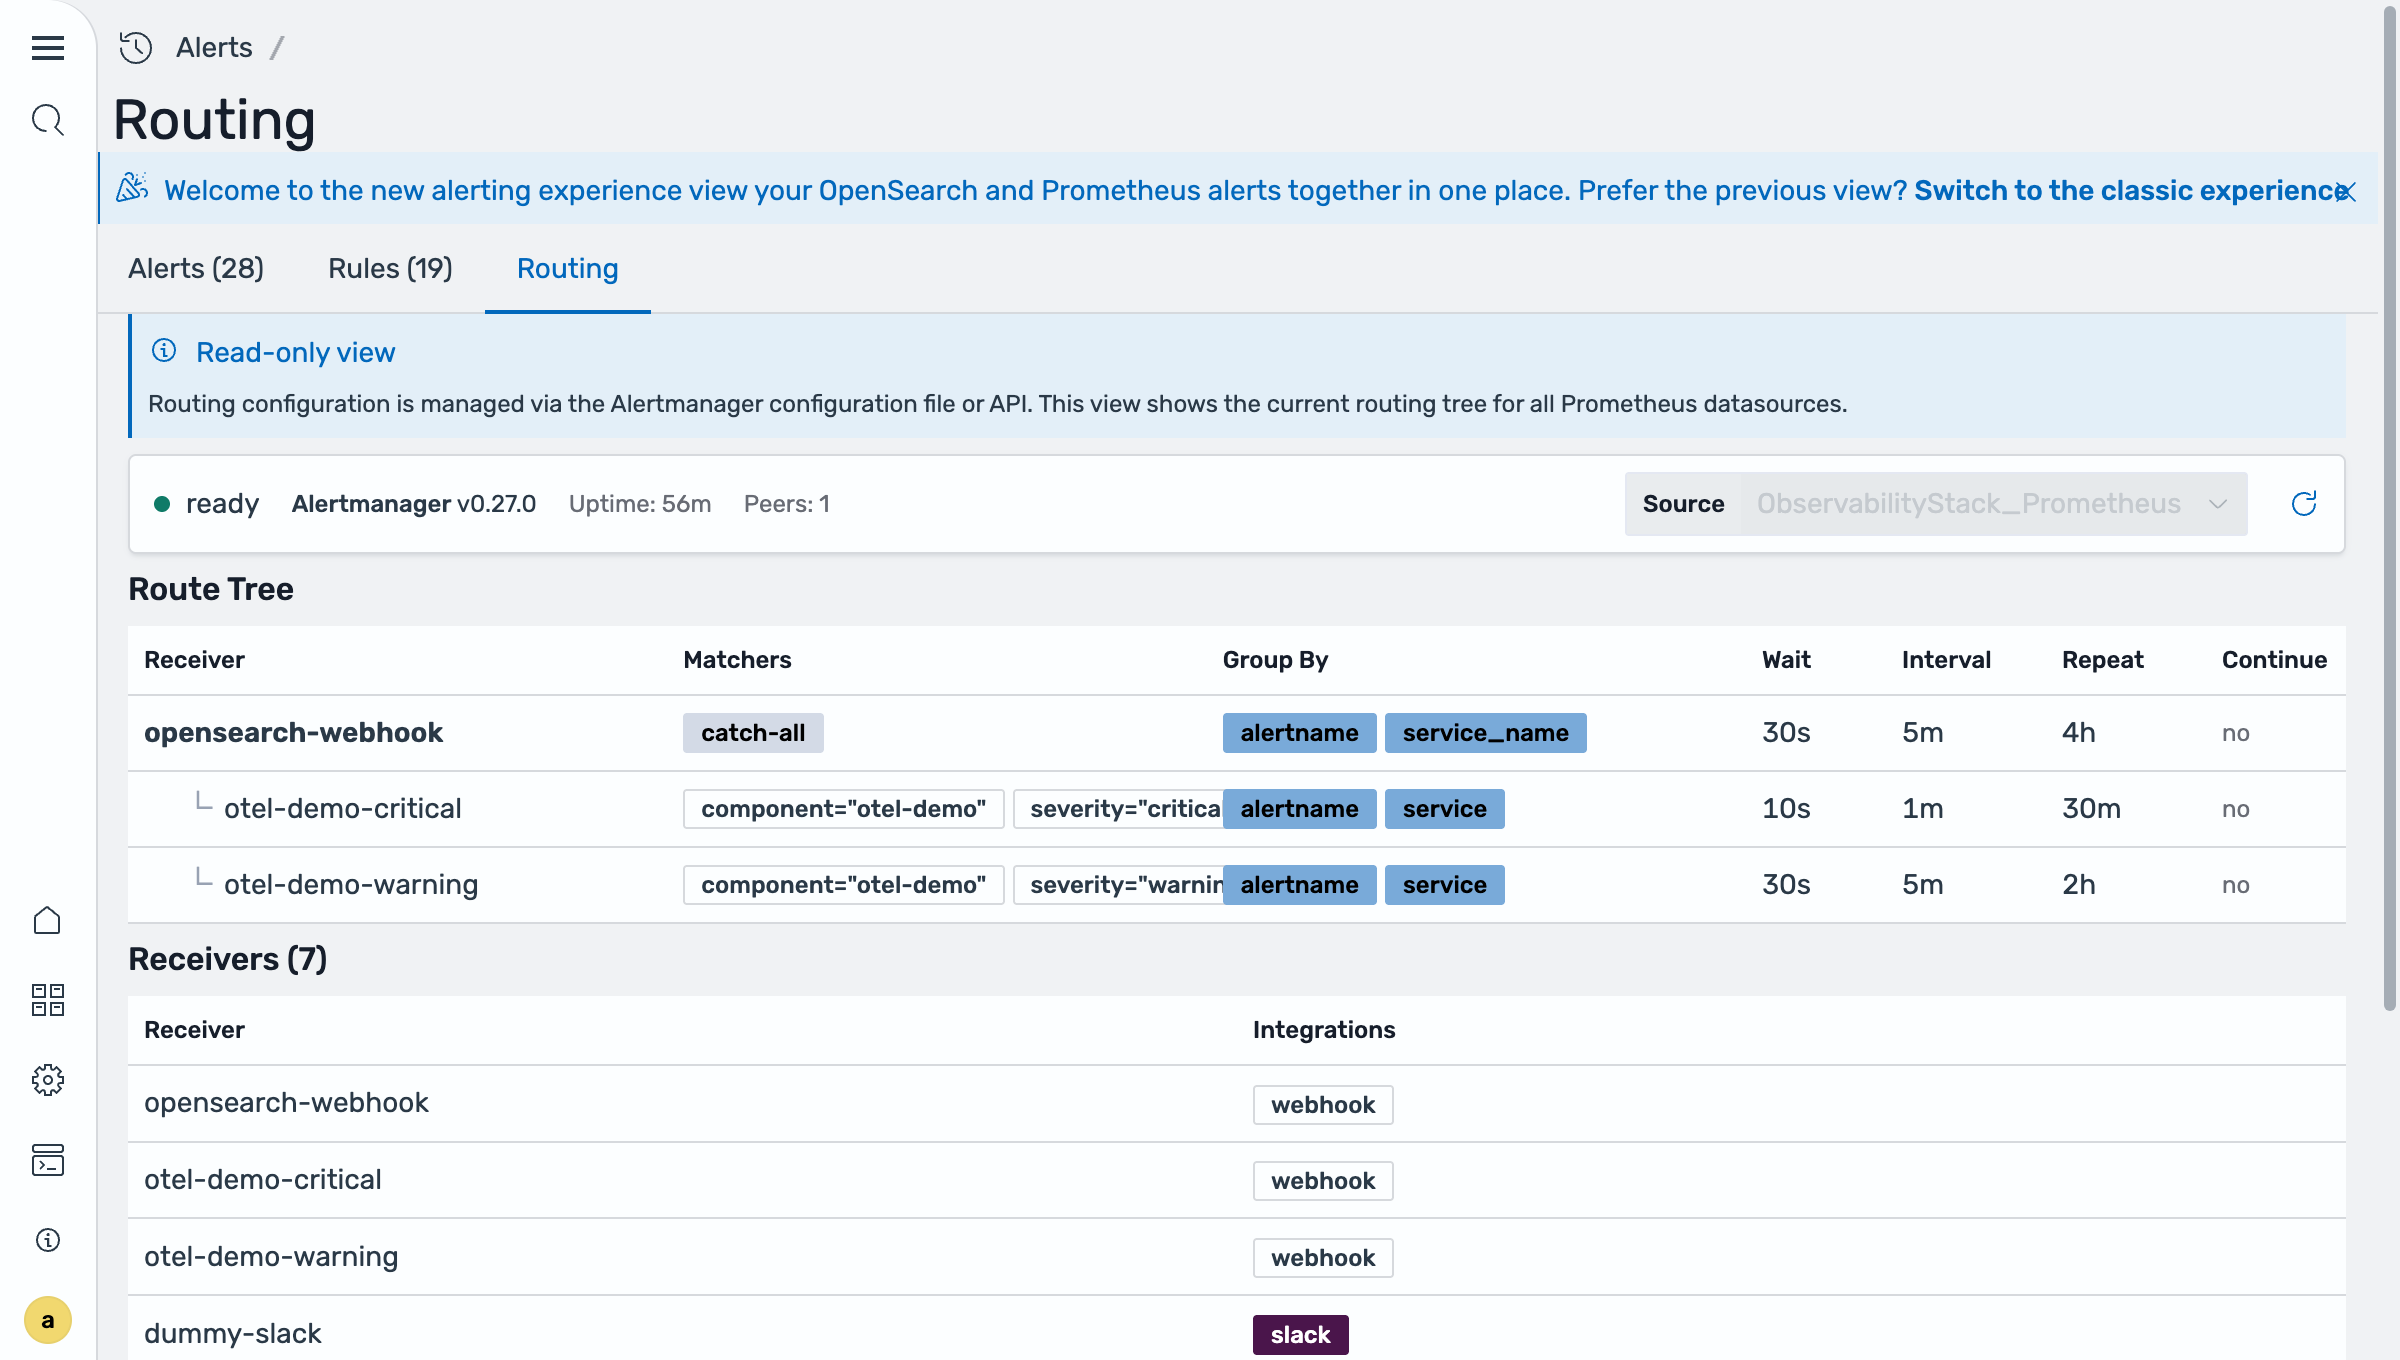
What the tab shows
Section titled “What the tab shows”- Status — the Alertmanager version, uptime, and peer count, plus a Source selector to pick which Prometheus data source’s routing to view.
- Route Tree — the routing hierarchy, top-down (first match wins). Each route shows its receiver, the matchers that select alerts (e.g.
component="otel-demo",severity="critical"), the Group By labels, and the Wait / Interval / Repeat timing that controls how alerts are batched and re-sent. - Receivers — every configured receiver and its integration type (webhook, Slack, email, PagerDuty, …).
Editing routing
Section titled “Editing routing”This view is read-only. Routing is managed in the Alertmanager configuration file (or API) — in this stack, docker-compose/alertmanager/alertmanager.template.yml. Edit that file to change routes or receivers, then use this tab to confirm the change took effect. For the full walkthrough of adding receivers and routes, see Notifications → Prometheus rules.
Related
Section titled “Related”- Notifications — configure the receivers and routes shown here.
- Explore Alerts — triage the alerts this tree delivers.
- Explore Rules — browse the rules that produce Prometheus alerts.