

PPL Inspect Query
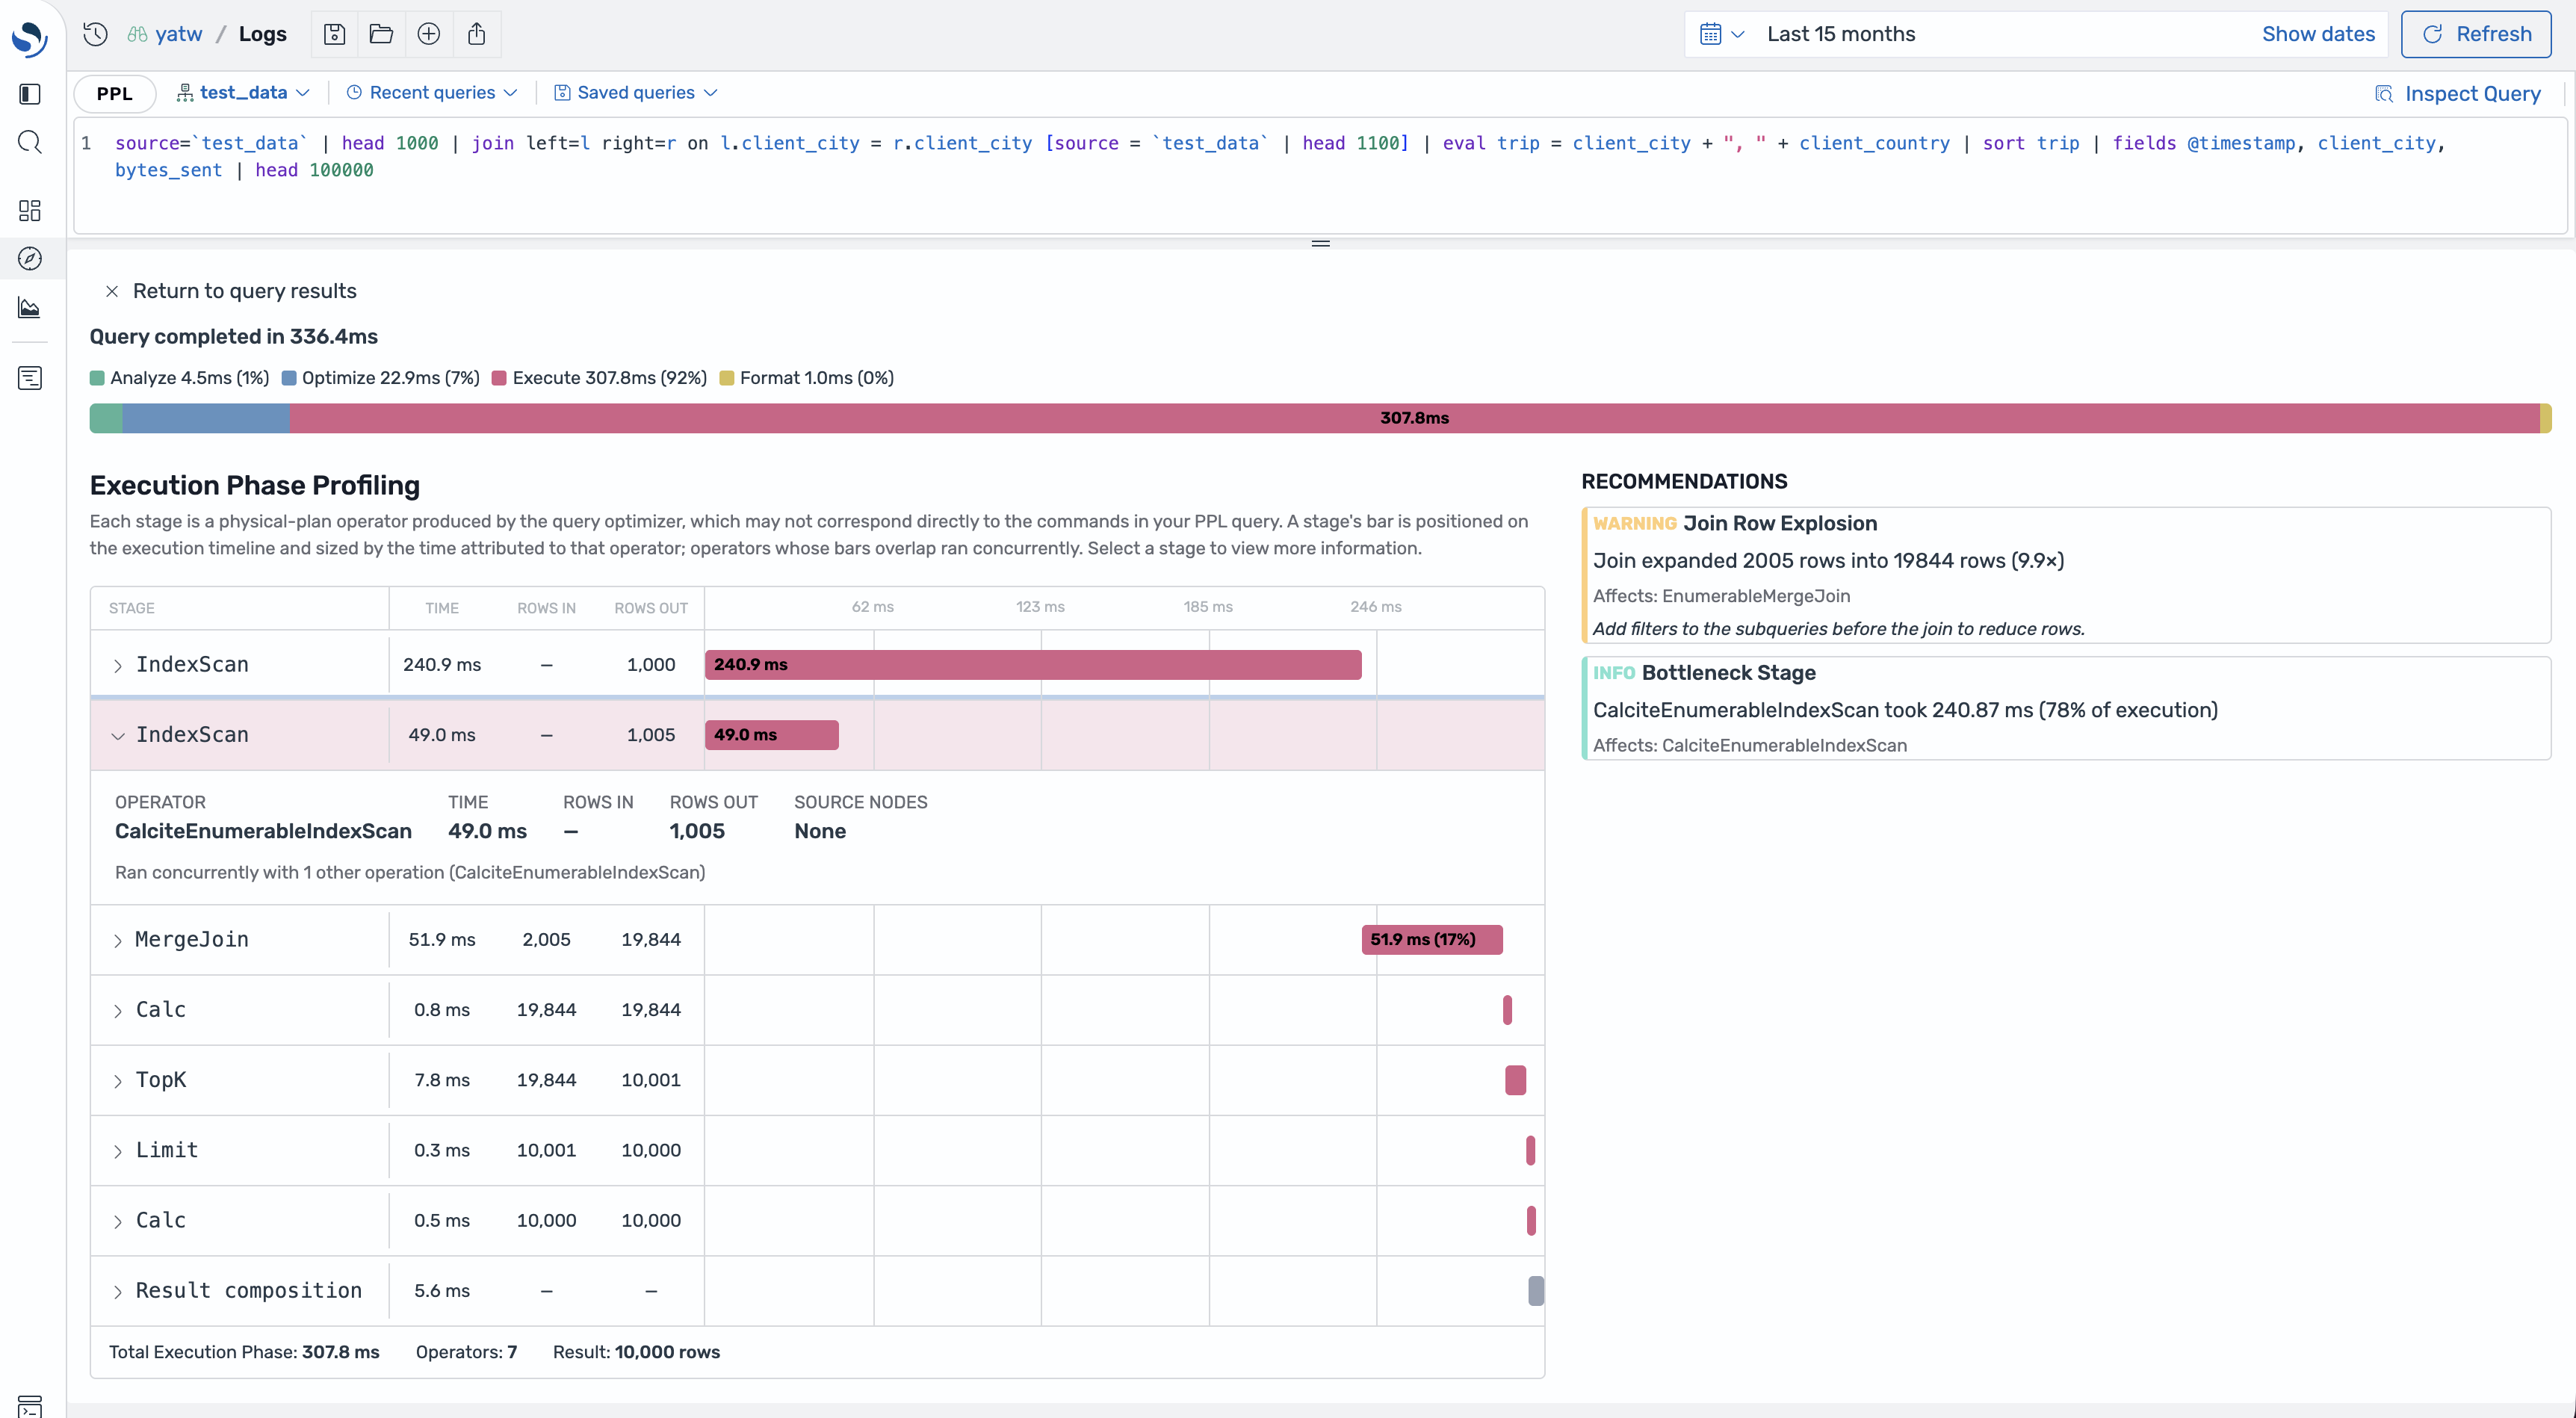
The Inspect Query panel provides insights to how OpenSearch executed a PPL query. It breaks the run into timing phases, reconstructs a diagram of the physical-plan operators the query optimizer produced, and surfaces rule-based recommendations for optimizing the query.
Use it to understand how your query executed. The panel provides metrics on how long each phase took, which operators did the most work, how many rows were passed between operations, and more
Opening the Inspect Query panel
Section titled “Opening the Inspect Query panel”Inspect Query lives on the Discover Logs query panel. When in PPL query mode, (not SQL, and not the natural-language prompt), an Inspect Query button appears in the query panel. Select it open the Inspect Query panel.
Each time you run a query with the inspector open, it re-analyzes in the background. Starting a new analysis (or closing the panel) cancels any run still in flight, so stale results never flash in. Like a normal PPL query, the analyze request is capped by the configured fetch size.
Query phase timing
Section titled “Query phase timing”The panel reports how long the query took to complete and breaks down each phase of the total query execution.
| Phase | What happens |
|---|---|
| Analyze | Parsing and validating the query syntax and semantics. |
| Optimize | Determining the most efficient execution plan and push-down strategy. |
| Execute | Running the query against OpenSearch and processing results. |
| Format | Formatting the final result set for output. |
Execution Phase Profiling
Section titled “Execution Phase Profiling”Below the phase analysis, Execution Phase Profiling reconstructs a waterfall graph from the query’s physical plan. Each row is one physical-plan operator produced by the optimizer.
Because these are physical operators, they may not map one-to-one to the commands in your PPL query, and their names are the engine’s own. Inspect Query strips the calling-convention prefixes (Calcite, Logical, OpenSearch, Enumerable, Bindable) for readability. The full, undecorated name is available when you expand the stage.
Stage details
Section titled “Stage details”Each stage row has these columns plus a timeline bar:
| Column | What it shows |
|---|---|
| STAGE | The physical-plan operation. |
| TIME | The time attributed to this operator alone (i.e. its own work, excluding the operators that feed it). |
| ROWS IN | Rows entering the operator, i.e. the sum of its source operators’ output. Blank (—) for a leaf. |
| ROWS OUT | Rows the operator emitted. |
Select a stage to expand it. The detail row shows the full OPERATOR name, its TIME, ROWS IN / ROWS OUT, and SOURCE NODES. SOURCE NODES are the operators that feed it (or None for a leaf).
Recommendations
Section titled “Recommendations”When the backend detects a likely inefficiency, Inspect Query lists rule-based recommendations beside the waterfall. Each carries a severity (CRITICAL, WARNING, or INFO), a short message (with the key figures emphasized), the operator it affects, and, where applicable, a suggested fix.
| Rule | Severity | Triggers when | Suggests |
|---|---|---|---|
| Join Row Explosion | WARNING / CRITICAL | A join emits many more rows than it takes in (e.g. 20× or more for CRITICAL). | Add filters to the subqueries before the join to reduce rows. |
| Ineffective Filter | WARNING | A filter or projection drops almost none of its input rows. | Remove the filter or make it more selective. |
| Expensive Sort | WARNING | A sort over a large input consumes a big share of the execute phase. | Filter or limit rows before sorting (e.g. add head or a where). |
| Bottleneck Stage | INFO | A single operator accounts for most of the execute phase. | — |
| Optimize Phase Dominates | INFO | Query planning took longer than executing. | — |
The panel sorts recommendations by severity and won’t show recommendations caused by operators using a small fraction of the execute phase. This way, users can focus on the operators that actually matter.
Under the hood
Section titled “Under the hood”Inspect Query is a UI over the PPL engine’s analyze request. You can issue the same request directly:
curl -X POST "localhost:9200/_plugins/_ppl" \ -H "Content-Type: application/json" \ -d '{"query": "source=`test_data` | where hour_24 > 2 | stats count()", "analyze": true}'The response carries profile.summary.total_time_ms, per-phase profile.phases, the nested physical plan under profile.plan (each node has node, time_ms, rows, and children), and a recommendations array. Inspect Query builds the timing bar, the waterfall, and the recommendations list from exactly these fields.
Enabling Inspect Query
Section titled “Enabling Inspect Query”Inspect Query is gated behind server-side settings. Add these to opensearch_dashboards.yml:
explore.enabled: trueexplore.pplAnalyze.enabled: trueRestart OpenSearch Dashboards to apply the change. With the setting off, the Discover Logs query panel shows no Inspect Query button.
See also
Section titled “See also”- PPL Query Builder - Build queries visually
- Discover Logs - The Logs page the inspector lives on
- Command Reference - Full list of PPL commands
- Function Reference - PPL functions