

Explore Alerts
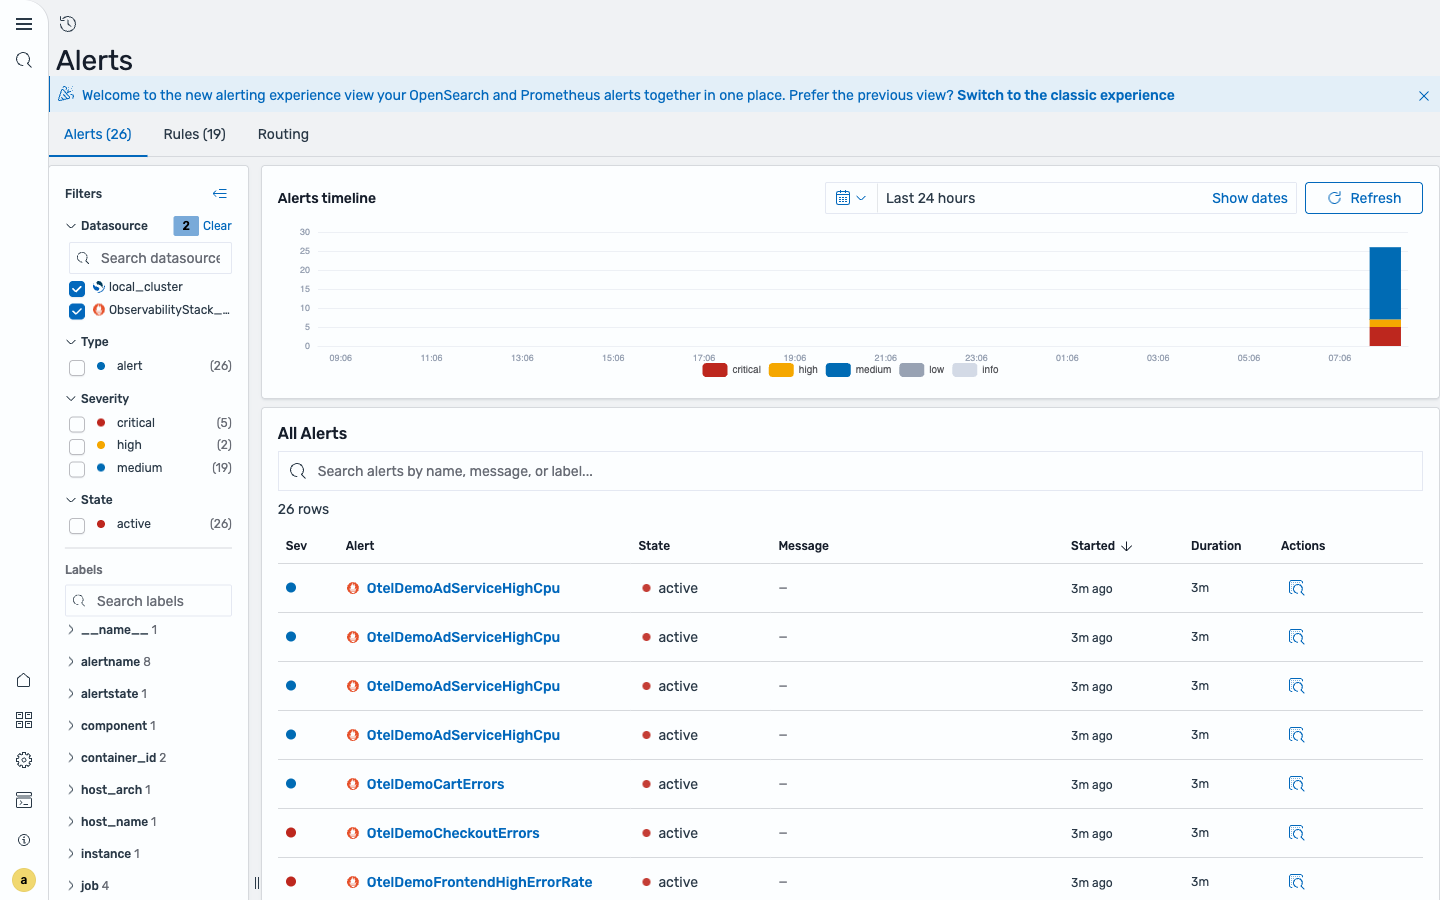
The Alerts tab of the Unified Alerts View is where responders triage active and historical signals. It combines OpenSearch log alerts, Prometheus metric alerts, and anomaly detector results from the selected data sources in one queue.
The alert list
Section titled “The alert list”Each row shows a signal’s severity, state, message, start time, and duration. The State value is anomaly for anomaly results. Sort or search to find a specific alert or anomaly.
Select an alert to open its detail panel — Alert Details, Labels, Annotations, and Raw Alert Data — with an Open rule button that jumps to the rule that produced it. To edit, disable, or delete that rule, use the Rules tab.
Inspect anomalies
Section titled “Inspect anomalies”Anomaly results appear directly in All Alerts. Results from the same detector and entity are grouped into one row with an occurrence count. Expand the row to compare the message, relative start time, and duration of each occurrence, then select an occurrence to inspect that exact anomaly.
The anomaly detail panel shows the selected occurrence’s grade, confidence, time, detector context, and feature values. For a detector with a categorical field, the panel includes an entity heat map and highlights the selected result. For a single-stream detector, it shows the detector’s metric series without an entity heat map.
If an alert is triggered by a detector result, select the alert to see the Associated anomaly section. It embeds the same anomaly context in the alert detail panel, and the linked anomaly is not repeated as a separate row in All Alerts.
Alert timeline
Section titled “Alert timeline”The histogram at the top of the tab buckets alerts and anomalies over the selected time range (default Last 24 hours), colored by severity. Use it to spot bursts — a spike of critical bars usually lines up with an incident. Narrow the time range to zoom into a window of interest.
Filters
Section titled “Filters”The left rail scopes the list without editing any query:
- Datasource — pick an OpenSearch data source (its alerts and anomaly results), a Prometheus data source (its alerts), or both.
- Severity —
critical,high,medium, and so on, with live counts. - State —
active,muted,anomaly, and (for OpenSearch)resolved. - Type —
alertoranomaly. - Labels — every label present on the current alert set (
alertname,component,service,job, …) becomes a facet. This is where Prometheus label cardinality pays off: filter to one service, one exporter, or one component in a click.
Selecting data sources
Section titled “Selecting data sources”By default both the OpenSearch cluster and the Prometheus data source are selected. Untick one in the Datasource filter to scope to a single engine. The tab counts update immediately.
Where alerts are routed
Section titled “Where alerts are routed”Firing metric-rule (Prometheus) alerts are grouped and delivered through the Prometheus Alertmanager. You can inspect that route tree on the Routing tab — see Routing. OpenSearch log-rule, APM, and cluster-metrics alerts instead notify through the actions attached to each rule’s triggers.
Empty list
Section titled “Empty list”If the Alerts tab is empty, no alerts or anomalies exist in the selected time range for the selected data sources. Confirm the right data sources are selected, widen the time range, create a rule or detector, or generate some load so the resources have data to evaluate.
Alert isn’t firing
Section titled “Alert isn’t firing”If a rule exists and is enabled but never produces an alert, work through this checklist. Open the rule from the Rules tab to see its definition while you check:
- Is the rule enabled? A disabled rule never evaluates. Check its status in the Rules catalog.
- Does the query return data? For a log rule, use Run preview in the rule editor — if it returns no rows, the condition can’t trip. Confirm data is actually flowing into the queried indices (
logs-otel-v1*,otel-v1-apm-span*) or Prometheus. - Is the condition threshold right? A
Number of resultstrigger fires on the row count; aCustom conditionfires when awhereclause matches an aggregated value. Make sure yourstats/threshold combination can actually be satisfied — see Trigger conditions. - Has enough time passed? The rule only evaluates on its schedule (log rules) or evaluation interval (metric rules). A metric rule also has a pending period / For Duration — the condition must hold continuously for that long before the alert becomes active.
- Right time window? Log-rule queries are bounded by the selected time field; a wrong or empty time field means no matching documents.
- Right data source selected? Confirm the alert’s data source isn’t filtered out of this view.
If the rule fires but no notification arrives, the rule is working and the problem is delivery — see Notifications → Verify delivery.
Related
Section titled “Related”- Explore Rules — browse the rules catalog and inspect definitions.
- Create Rules — build alerting rules, anomaly detectors, and forecasters.
- Notifications — route firing alerts to Slack, email, PagerDuty, and webhooks.
- Unified Alerts View — overview, resource types, and classic monitors.