

Explore Rules
The Rules tab of the Unified Alerts View is the catalog of everything you define for alerting, anomaly detection, and forecasting. Where the Alerts tab shows alerts and detected anomalies, the Rules tab shows the resources that evaluate, model, or predict your data.
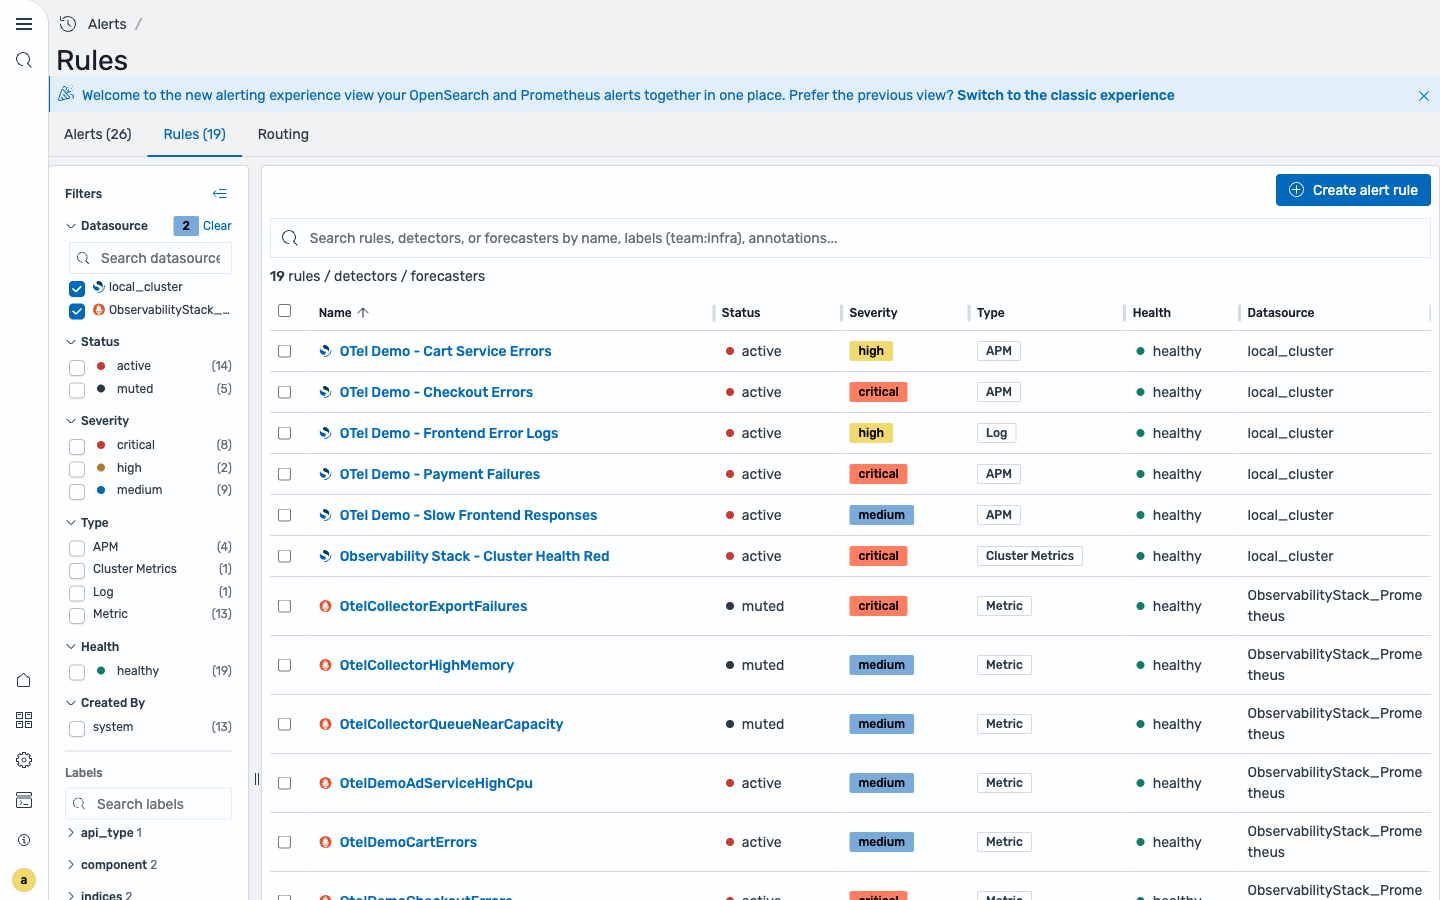
The rules catalog
Section titled “The rules catalog”Each row shows a resource’s name, status, severity, type, health, and owning data source. Detector and forecaster statuses reflect their runtime state, such as Running, Stopped, or Initializing, rather than a generic active state.
The Type facet includes Log, Metric, Anomaly Detector, Forecaster, APM, and Cluster Metrics. See Resource types for what each one means. To add a resource, use Create — see Create Rules.
Inspect and manage a resource
Section titled “Inspect and manage a resource”Select a resource to open its detail panel. The content and actions depend on its type.
- An alerting rule shows its query definition, conditions & evaluation, labels, a condition preview, and recent alerts. Its actions include edit, clone, enable or disable, and delete.
- An anomaly detector shows detector settings, model features, operation settings, additional settings, and job state. Use the panel to start or stop the detector, edit detector settings, or edit the model configuration.
- A forecaster shows forecaster settings, its indicator and model configuration, operational settings, result index, and job state. Use the panel to start or stop the forecaster or edit its definition.
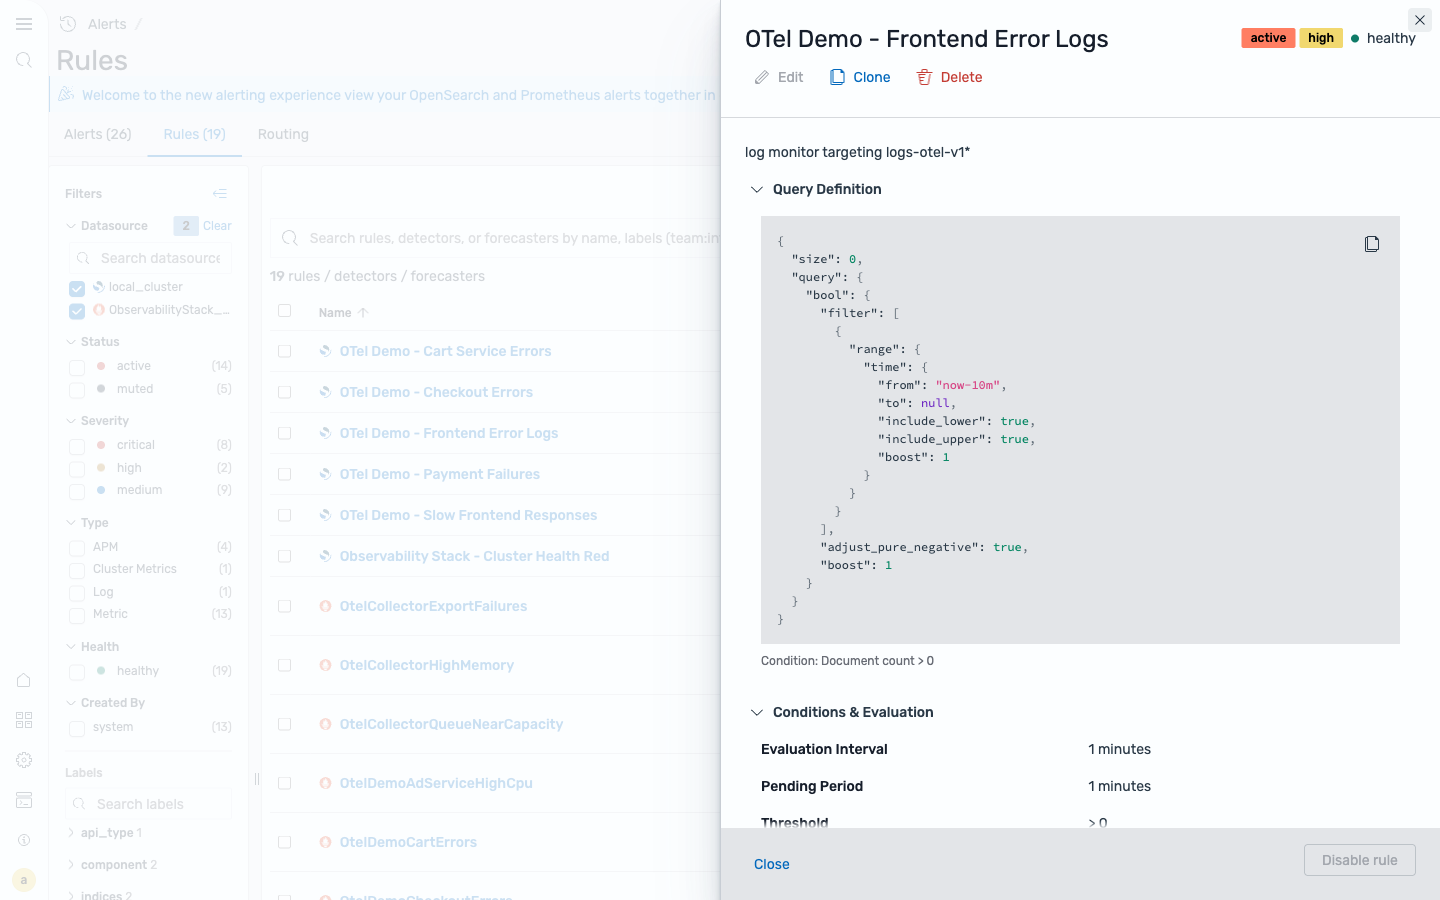
Available lifecycle actions include:
| Action | What it does |
|---|---|
| Edit | Change an alerting rule, detector, or forecaster definition. A running detector or active forecaster must be stopped before it can be edited. |
| Clone | Duplicate a supported alerting rule as a starting point for a similar one. |
| Disable rule / Enable | Stop or resume alert-rule evaluation without deleting the rule. |
| Start / Stop | Start or stop a detector or forecaster job. |
| Delete | Remove the selected resource permanently. |
When you edit a running detector, the flyout asks to stop it before continuing and offers to start it again after the update. You can also select detector or forecaster rows in the table and apply start, stop, or delete actions to the selection.
Filters
Section titled “Filters”The left rail is shared with the Alerts tab and scopes the catalog the same way:
- Datasource — the OpenSearch cluster, the Prometheus data source, or both.
- Severity —
critical,high,medium, and so on. - Type —
Log,Metric,Anomaly Detector,Forecaster,APM, orCluster Metrics. - Labels — filter to one service, exporter, or component in a click.
Empty catalog
Section titled “Empty catalog”If the Rules tab is empty, there are no alerting rules, detectors, or forecasters for the selected data sources yet. Confirm the right data sources are selected in the filter, or create a resource.
Related
Section titled “Related”- Explore Alerts — triage alerts and detected anomalies.
- Create Rules — build alerting rules, anomaly detectors, and forecasters.
- Routing — the Prometheus Alertmanager route tree for metric alerts.
- Unified Alerts View — overview, resource types, and classic monitors.