

Create Rules
You create alert rules from the Rules tab of the Unified Alerts View. Choose Create alert rule, then pick Logs or Metrics.
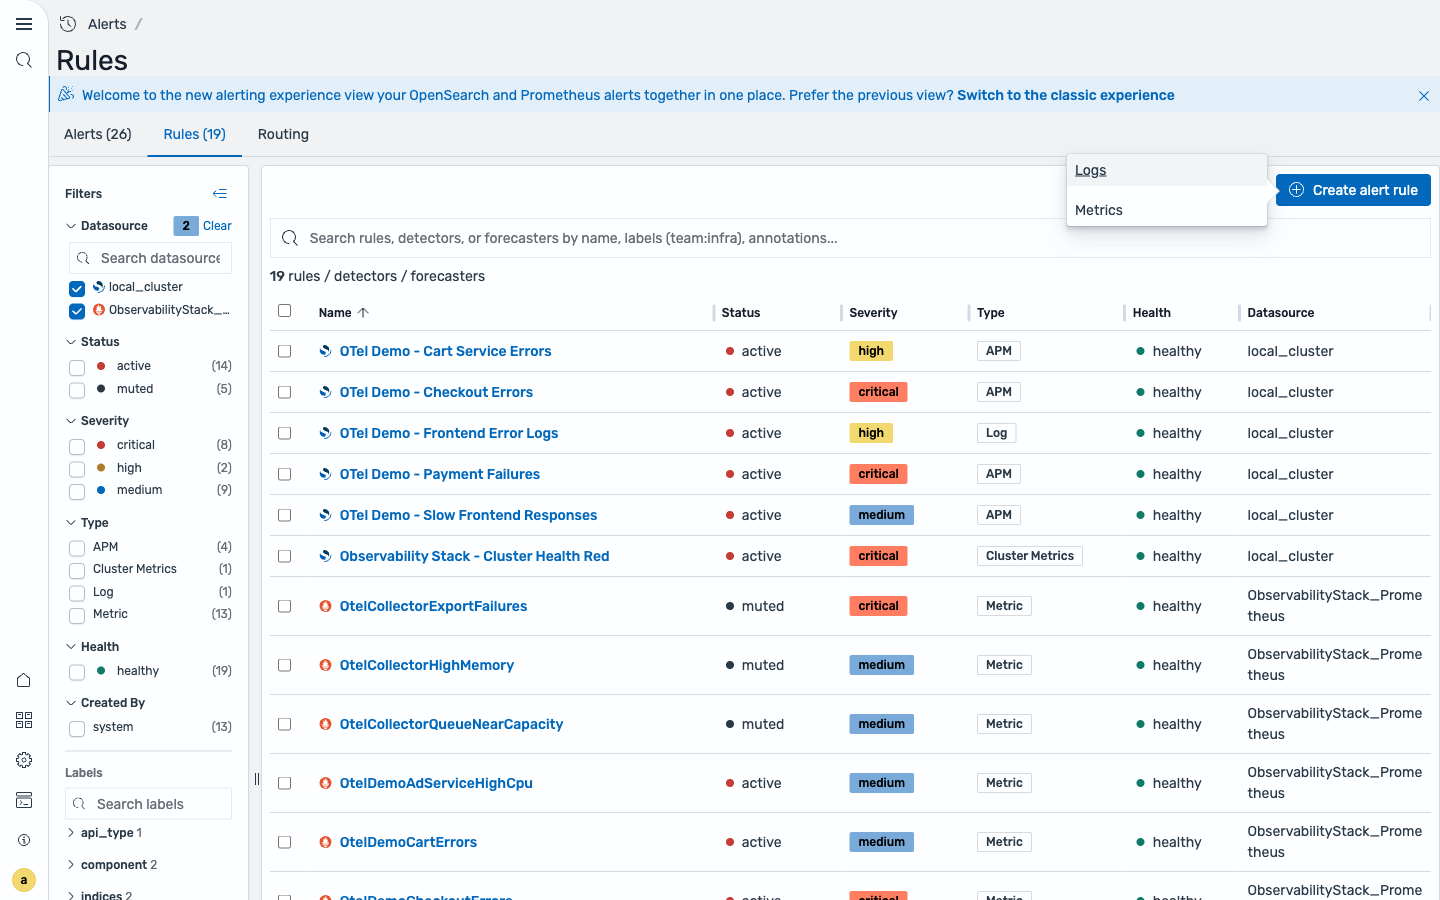
Both rule types deploy to the correct engine and surface in the Rules catalog and the Alerts tab. See Explore Alerts for what happens after they fire.
Log rule (PPL)
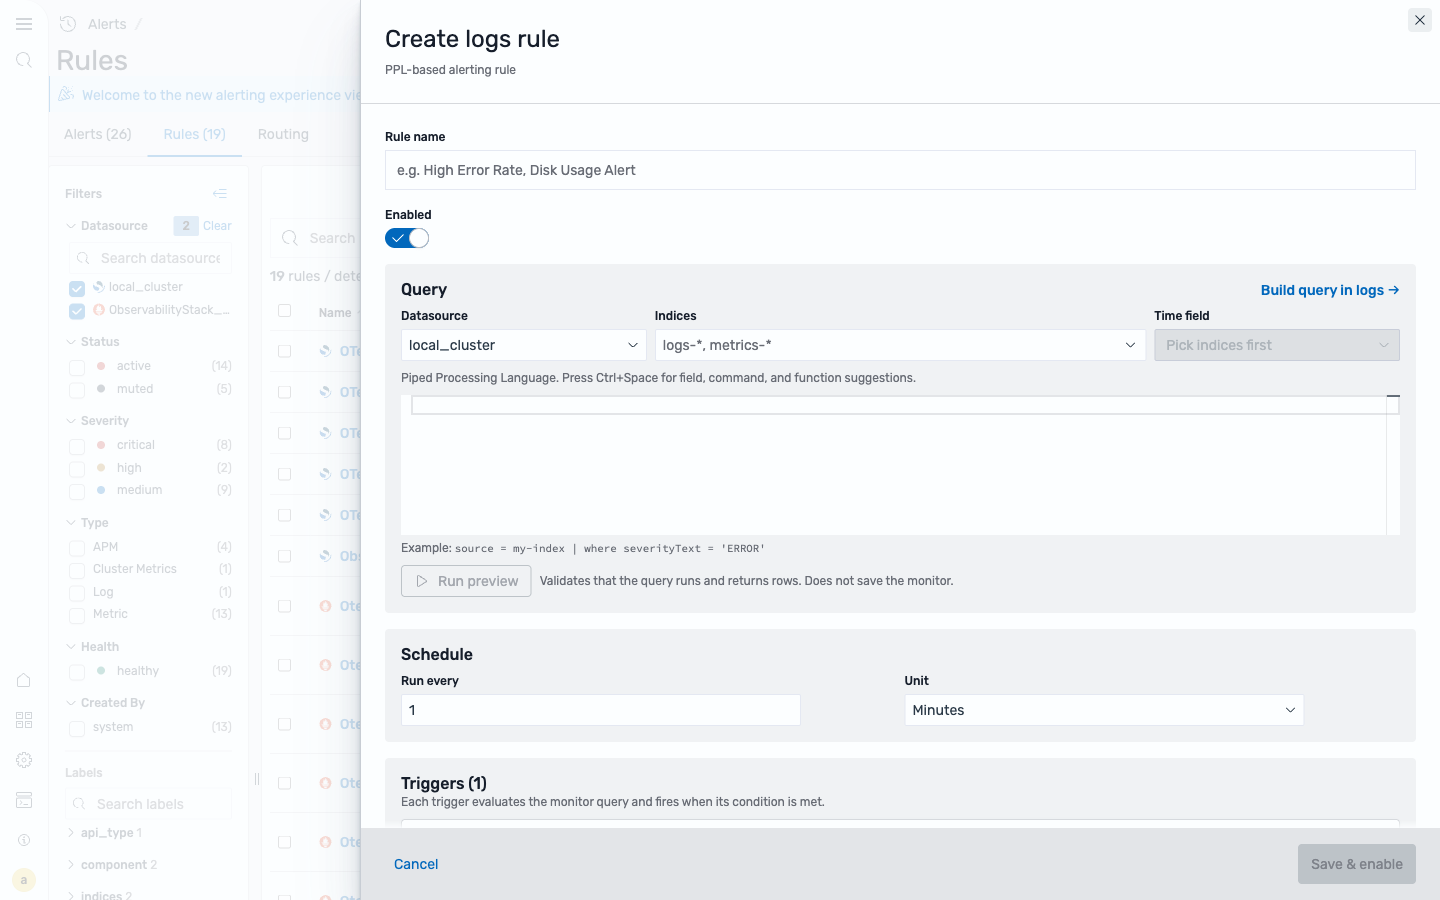
Section titled “Log rule (PPL)”A log rule alerts on data indexed in OpenSearch — your logs and traces. You write the query in PPL (Piped Processing Language), the same piped language you use in Discover and the PPL query builder, and the rule fires when the query’s results meet a condition you set.
-
Name the rule and leave it Enabled.
-
Set the query. Pick the data source (your OpenSearch cluster) and the indices to query — wildcards like
logs-otel-v1*are kept verbatim — then select the time field. -
Write the PPL query. Press
Ctrl+Spacefor field, command, and function suggestions. Use Run preview to confirm the query runs and returns rows.source=logs-otel-v1* | where severityNumber >= 17 | stats count() as error_count -
Set the schedule — how often the rule runs (for example, every
1minute). -
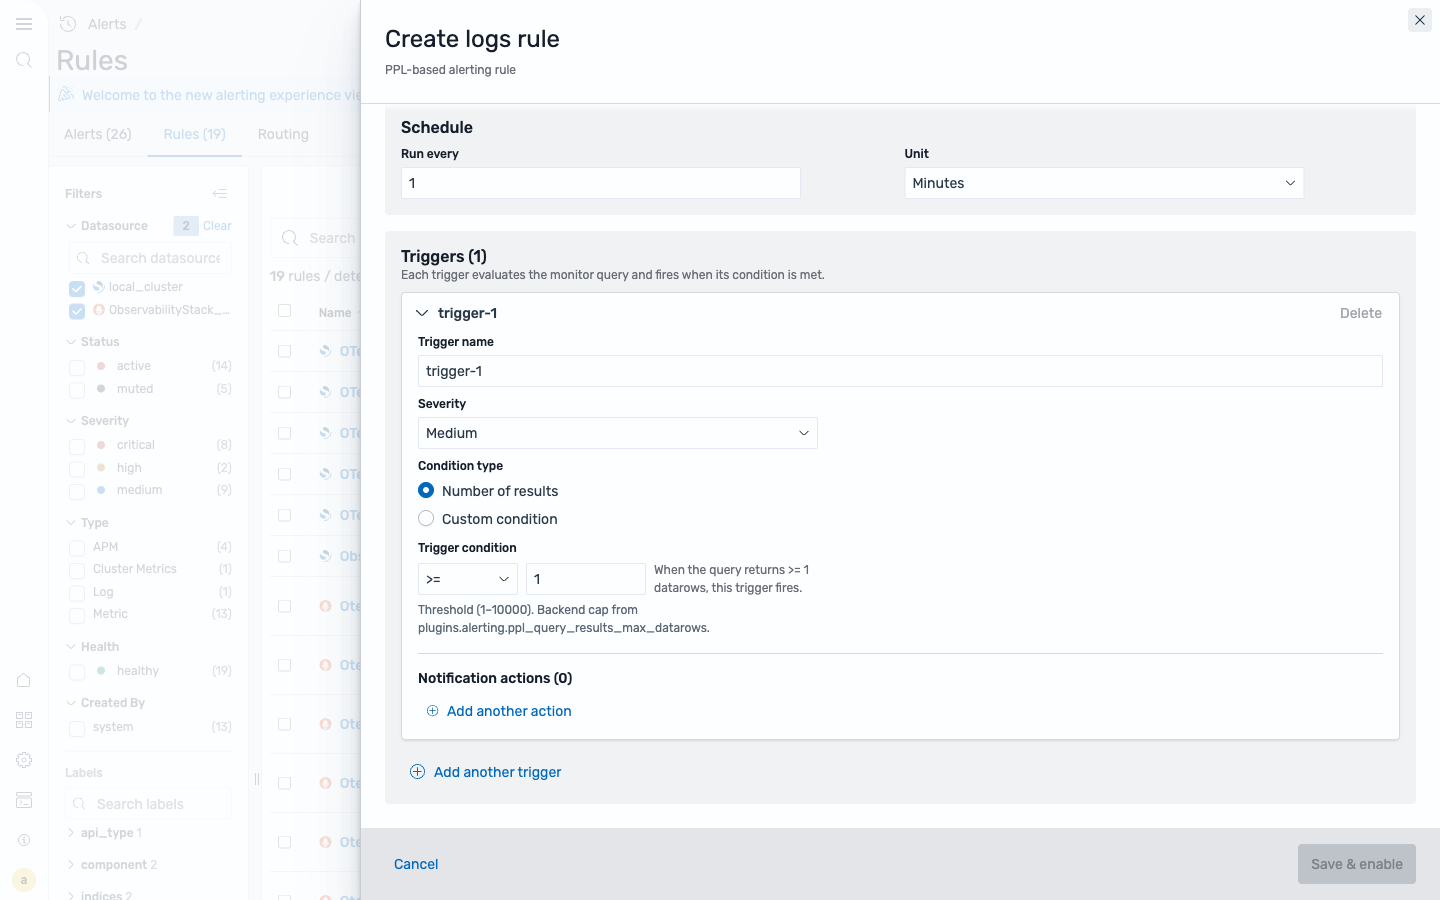
Add a trigger — a name, severity, and condition (see Trigger conditions). Optionally add notification actions to send the alert to Slack, email, or a webhook.
-
Save & enable. The rule appears in the Rules catalog tagged Log, and firing alerts show up in the Alerts tab.
Trigger conditions
Section titled “Trigger conditions”A log-rule trigger evaluates the PPL query and fires when its condition is met. Two condition types are available:
| Condition type | Fires when | Use it for |
|---|---|---|
| Number of results | The count of rows the query returns satisfies an operator/value (>, >=, <, <=, ==, !=) | Alerting on how many rows come back — for example, one row per offending service from a stats ... by service query. |
| Custom condition | A PPL where clause you supply (it must start with where) matches a row of the results — e.g. where error_count > 100 | Threshold checks on an aggregated value. Pair with a stats query. |
The most reliable shape is to aggregate with stats first, then compare the aggregated value in a custom condition:
source=logs-otel-v1* | where severityNumber >= 17 | stats count() as error_countwhere error_count > 100When the query returns an error_count above 100, the trigger fires and runs its notification actions.
More log-rule examples
Section titled “More log-rule examples”Alert when any service’s error count crosses a threshold — one row per service, custom condition on the aggregate:
source=logs-otel-v1* | where severityNumber >= 17 | stats count() as error_count by serviceNamewhere error_count > 50Alert on slow traces from a specific service:
source=otel-v1-apm-span* | where serviceName = "frontend" and durationInNanos > 500000000 | stats count() as slow_spanswhere slow_spans > 20For the full PPL language reference, see PPL — Query Language.
Metric rule (PromQL)
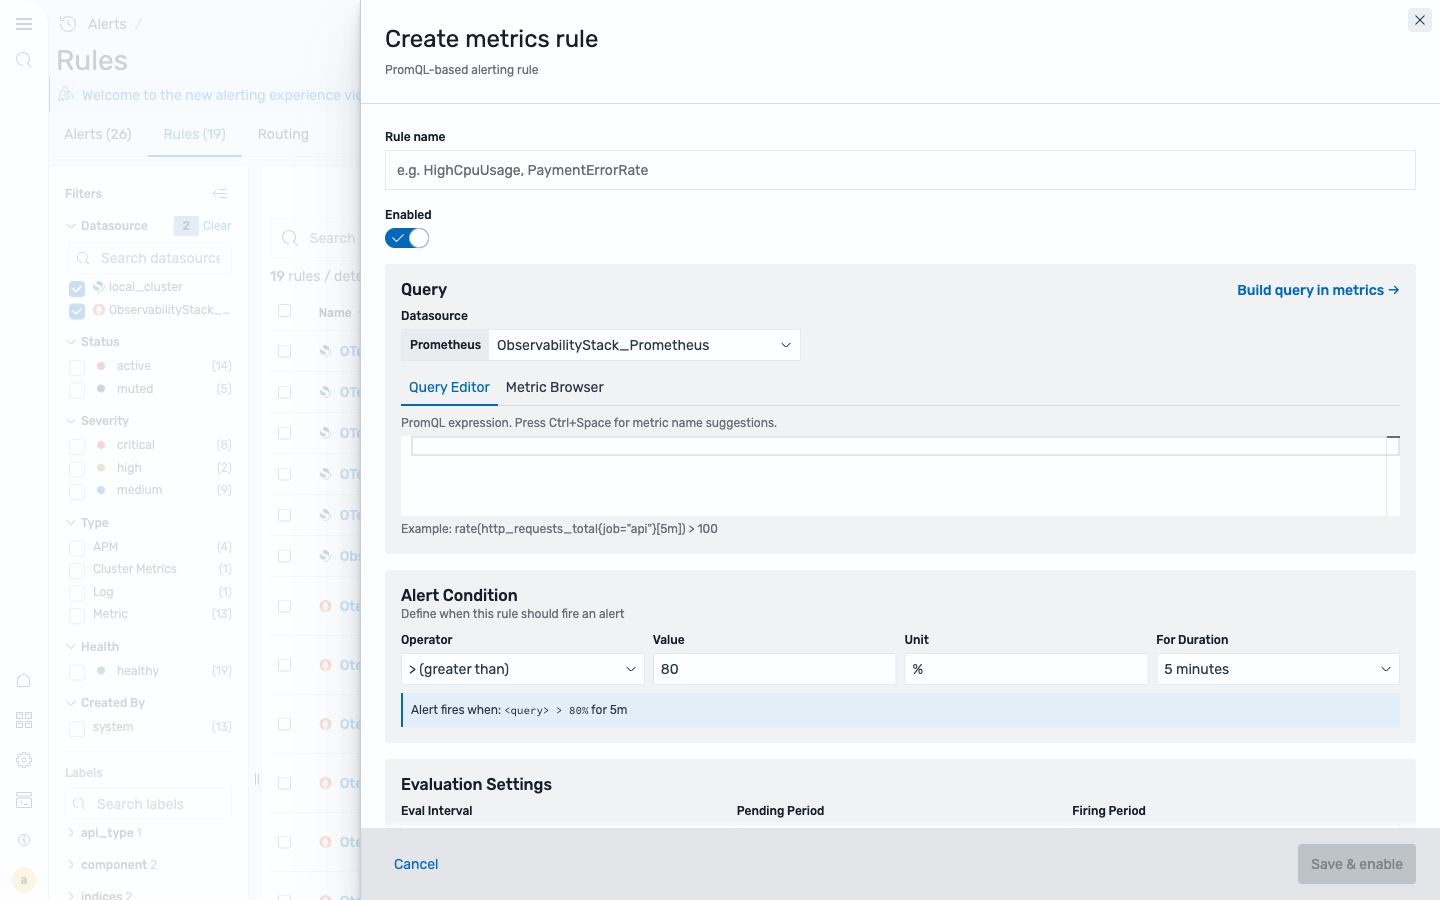
Section titled “Metric rule (PromQL)”A metric rule alerts on Prometheus time series. You write a PromQL expression, then define the condition and evaluation timing.
-
Name the rule and leave it Enabled.
-
Write the PromQL query against the Prometheus data source. Press
Ctrl+Spacefor metric-name suggestions, or use the Metric Browser / Build query in metrics to construct it.rate(http_requests_total{job="api"}[5m]) > 100 -
Set the alert condition — an operator, value, optional unit, and a For Duration the condition must hold before firing. The form shows a live “Alert fires when…” summary.
-
Tune evaluation settings — the eval interval, pending period, and firing period.
-
Add labels (for routing and filtering), then Save & enable. The rule appears tagged Metric, and firing alerts join the Alerts tab.
Metric-rule alerts are delivered through the Prometheus Alertmanager — set up where they go in Notifications, and view the resulting routing tree. Because SLOs deploy their burn-rate alerts as Prometheus rules, SLO breaches show up here as Metric rules too.
Anomaly detection rule
Section titled “Anomaly detection rule”An anomaly detection rule creates an OpenSearch anomaly detector. The detector learns the expected behavior of one or more aggregated features and identifies data points that differ from that behavior.
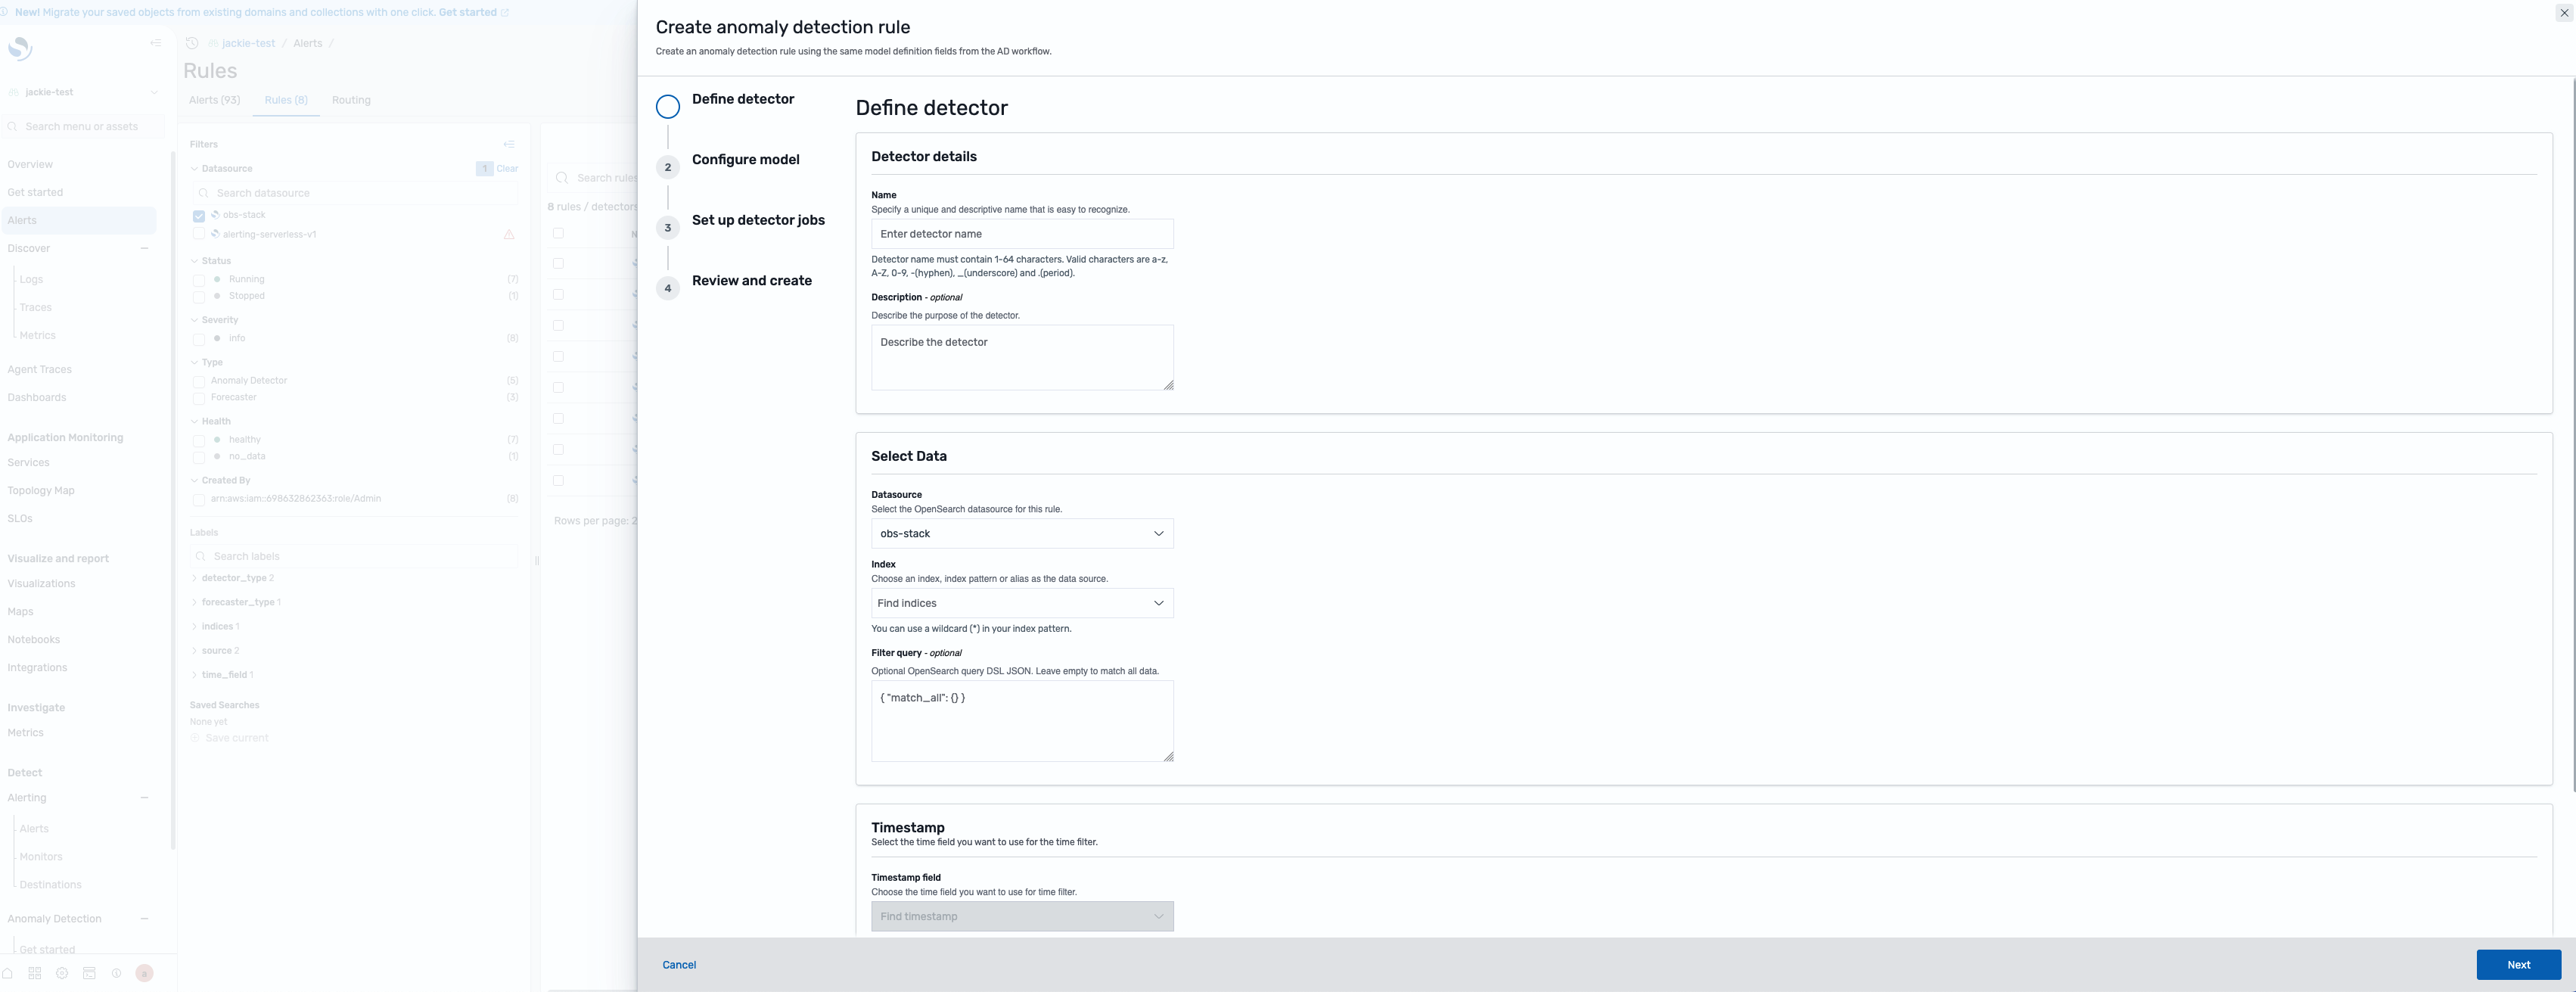
The flyout follows four steps:
-
Define detector. Enter a unique name and optional description. Select a compatible OpenSearch data source, one or more indices, an optional Query DSL filter, and the timestamp field. You can also store results in a custom result index.
-
Configure model. Add up to five features. For each feature, choose an aggregation method and field. Optionally add a categorical field to detect anomalies independently for each entity, then set the detection interval, frequency, window delay, and history. Use Suggest parameters for recommended operation settings, or open Advanced model parameters to configure the shingle size.
-
Set up detector jobs. Choose whether to start real-time detection automatically after creation. Automatic start is enabled by default.
-
Review and create. Confirm the data source, indices, timestamp, features, category field, and schedule, then choose Create rule. The detector appears in the Rules catalog. After the model initializes, detected anomalies appear in the Alerts tab.
For definitions of features, categorical detectors, anomaly grade, and confidence, see Anomaly Detection.
Forecasting rule
Section titled “Forecasting rule”A forecasting rule creates an OpenSearch forecaster that predicts an aggregated indicator over a future horizon. Creating the rule also starts the forecaster.
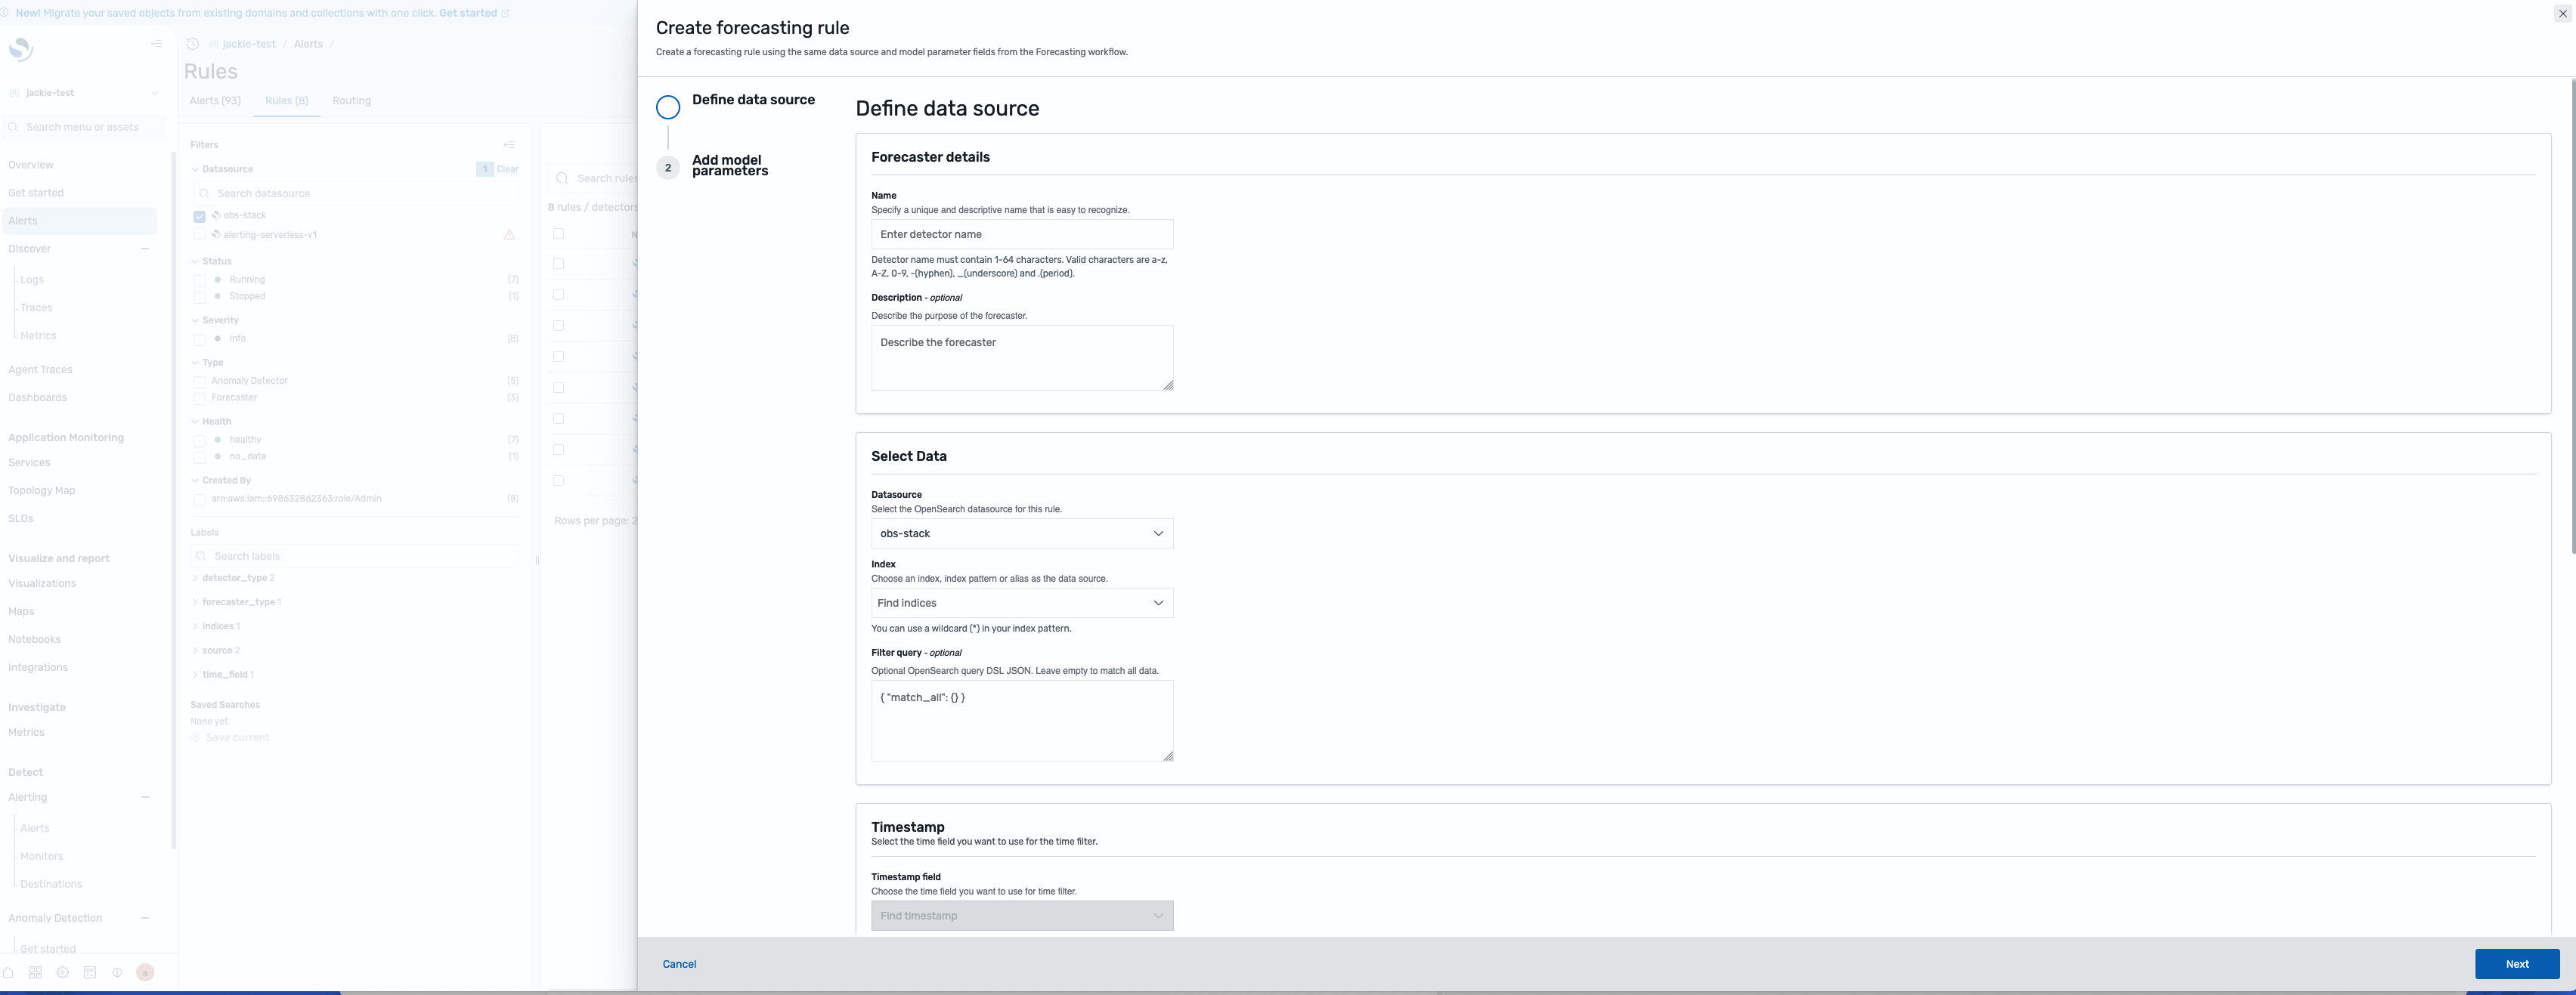
The flyout follows two steps:
-
Define data source. Enter a unique name and optional description. Select a compatible OpenSearch data source, indices, an optional Query DSL filter, and the timestamp field. Define the indicator by choosing its name, aggregation method, and field. You can also add a categorical field to generate forecasts per entity.
-
Add model parameters. Set the forecasting interval, window delay, horizon, and history. Choose the default result index or configure a custom result index and its lifecycle settings, then choose Create rule. The forecaster starts and appears in the Rules catalog.
Forecasters do not add rows to the Alerts tab by themselves. Use the Rules catalog to check whether a forecaster is running and to inspect or manage its definition. For forecasting concepts and result interpretation, see Forecasting.
Related
Section titled “Related”- Notifications — route firing alerts to Slack, email, PagerDuty, and webhooks.
- Unified Alerts View — overview, rule types, and classic monitors.
- Explore Alerts — triage the alerts your rules produce.
- Explore Rules — browse the rules catalog and view routing.
- PPL — Query Language — the language behind log rules.