

Explore Application Monitoring
This quickstart is for backend and platform engineers who want to understand a distributed application from the outside in. You will start with trace data, open the service map, inspect RED metrics, and follow a service back to its traces and logs.
Before you begin
Section titled “Before you begin”You need:
- A running Observability Stack. The default example services generate trace data.
- Or the OpenTelemetry Demo enabled in
.envwithINCLUDE_COMPOSE_OTEL_DEMO=docker-compose.otel-demo.yml. - An Observability workspace in OpenSearch Dashboards with APM configured.
For a clean local setup, follow the installation guide. The OpenTelemetry Demo is especially useful here because it produces telemetry from multiple services and shows real dependency paths.
1. Open Application Monitoring
Section titled “1. Open Application Monitoring”- Open OpenSearch Dashboards.
- Open Observability → Application Monitoring.
- Select Services.
You should see a service catalog with request rate, failure rate, and latency information. Select a service to open its detail view.
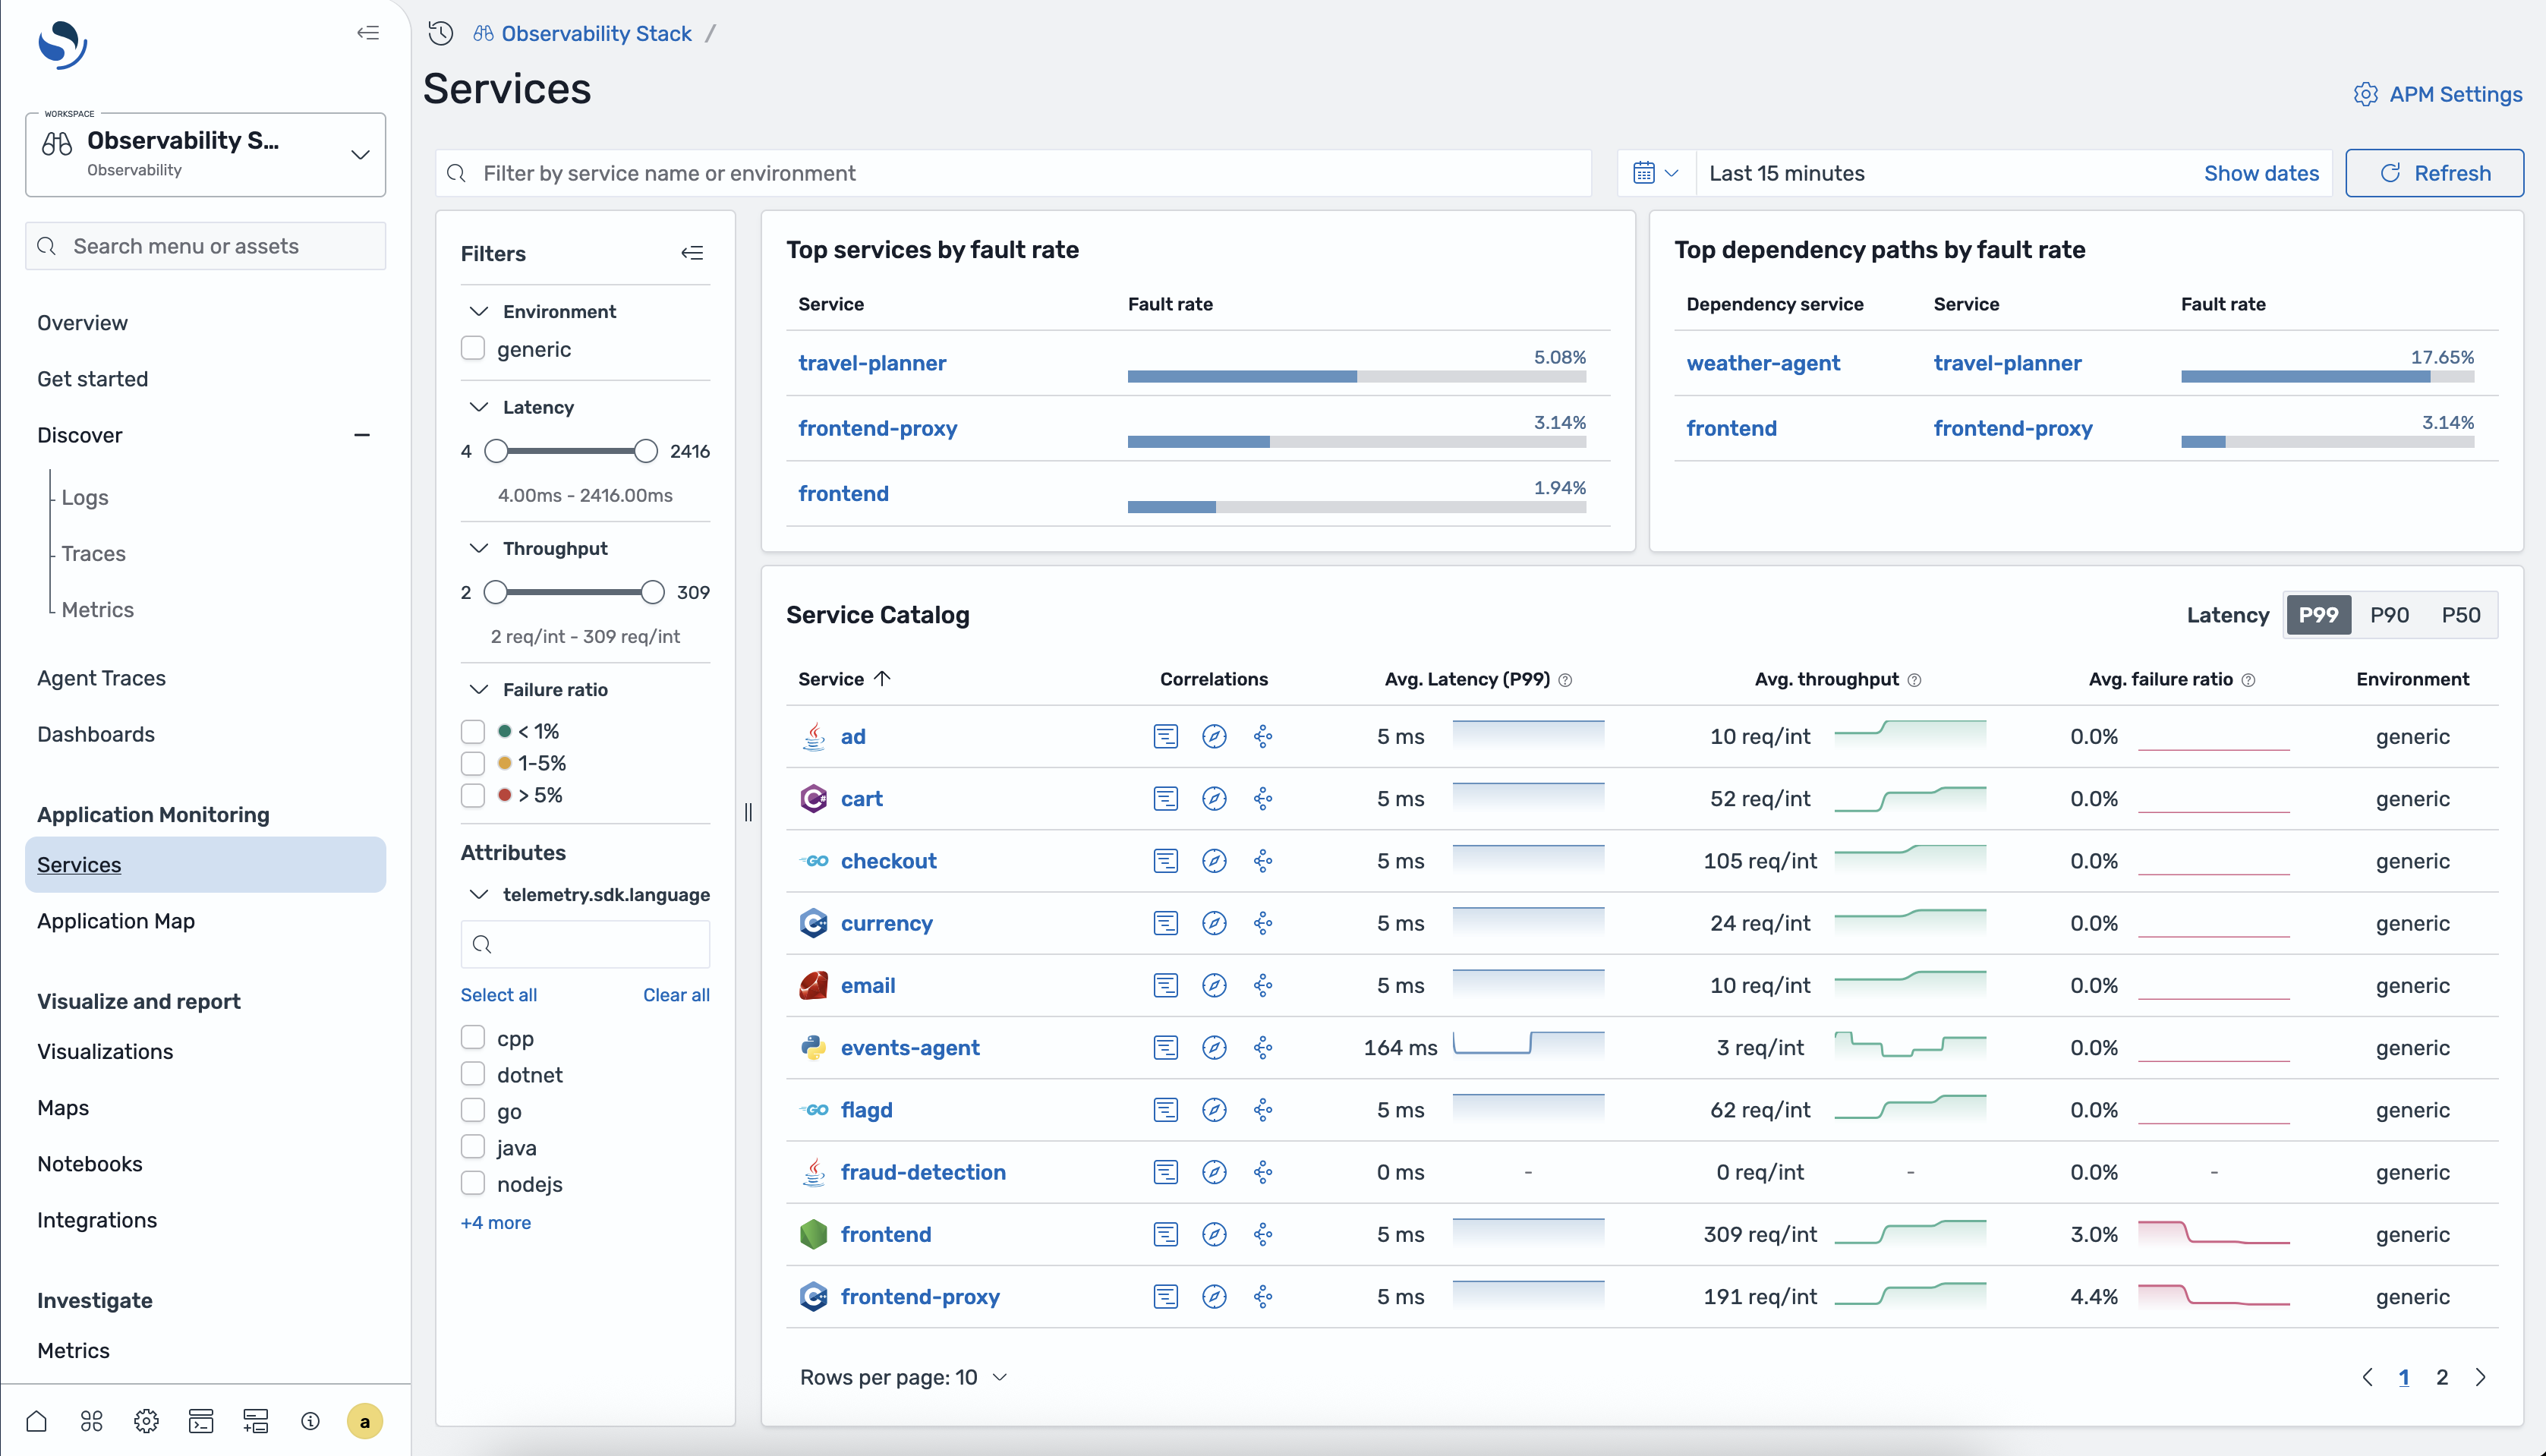
If the catalog is empty, see Troubleshooting APM.
2. Explore the service map
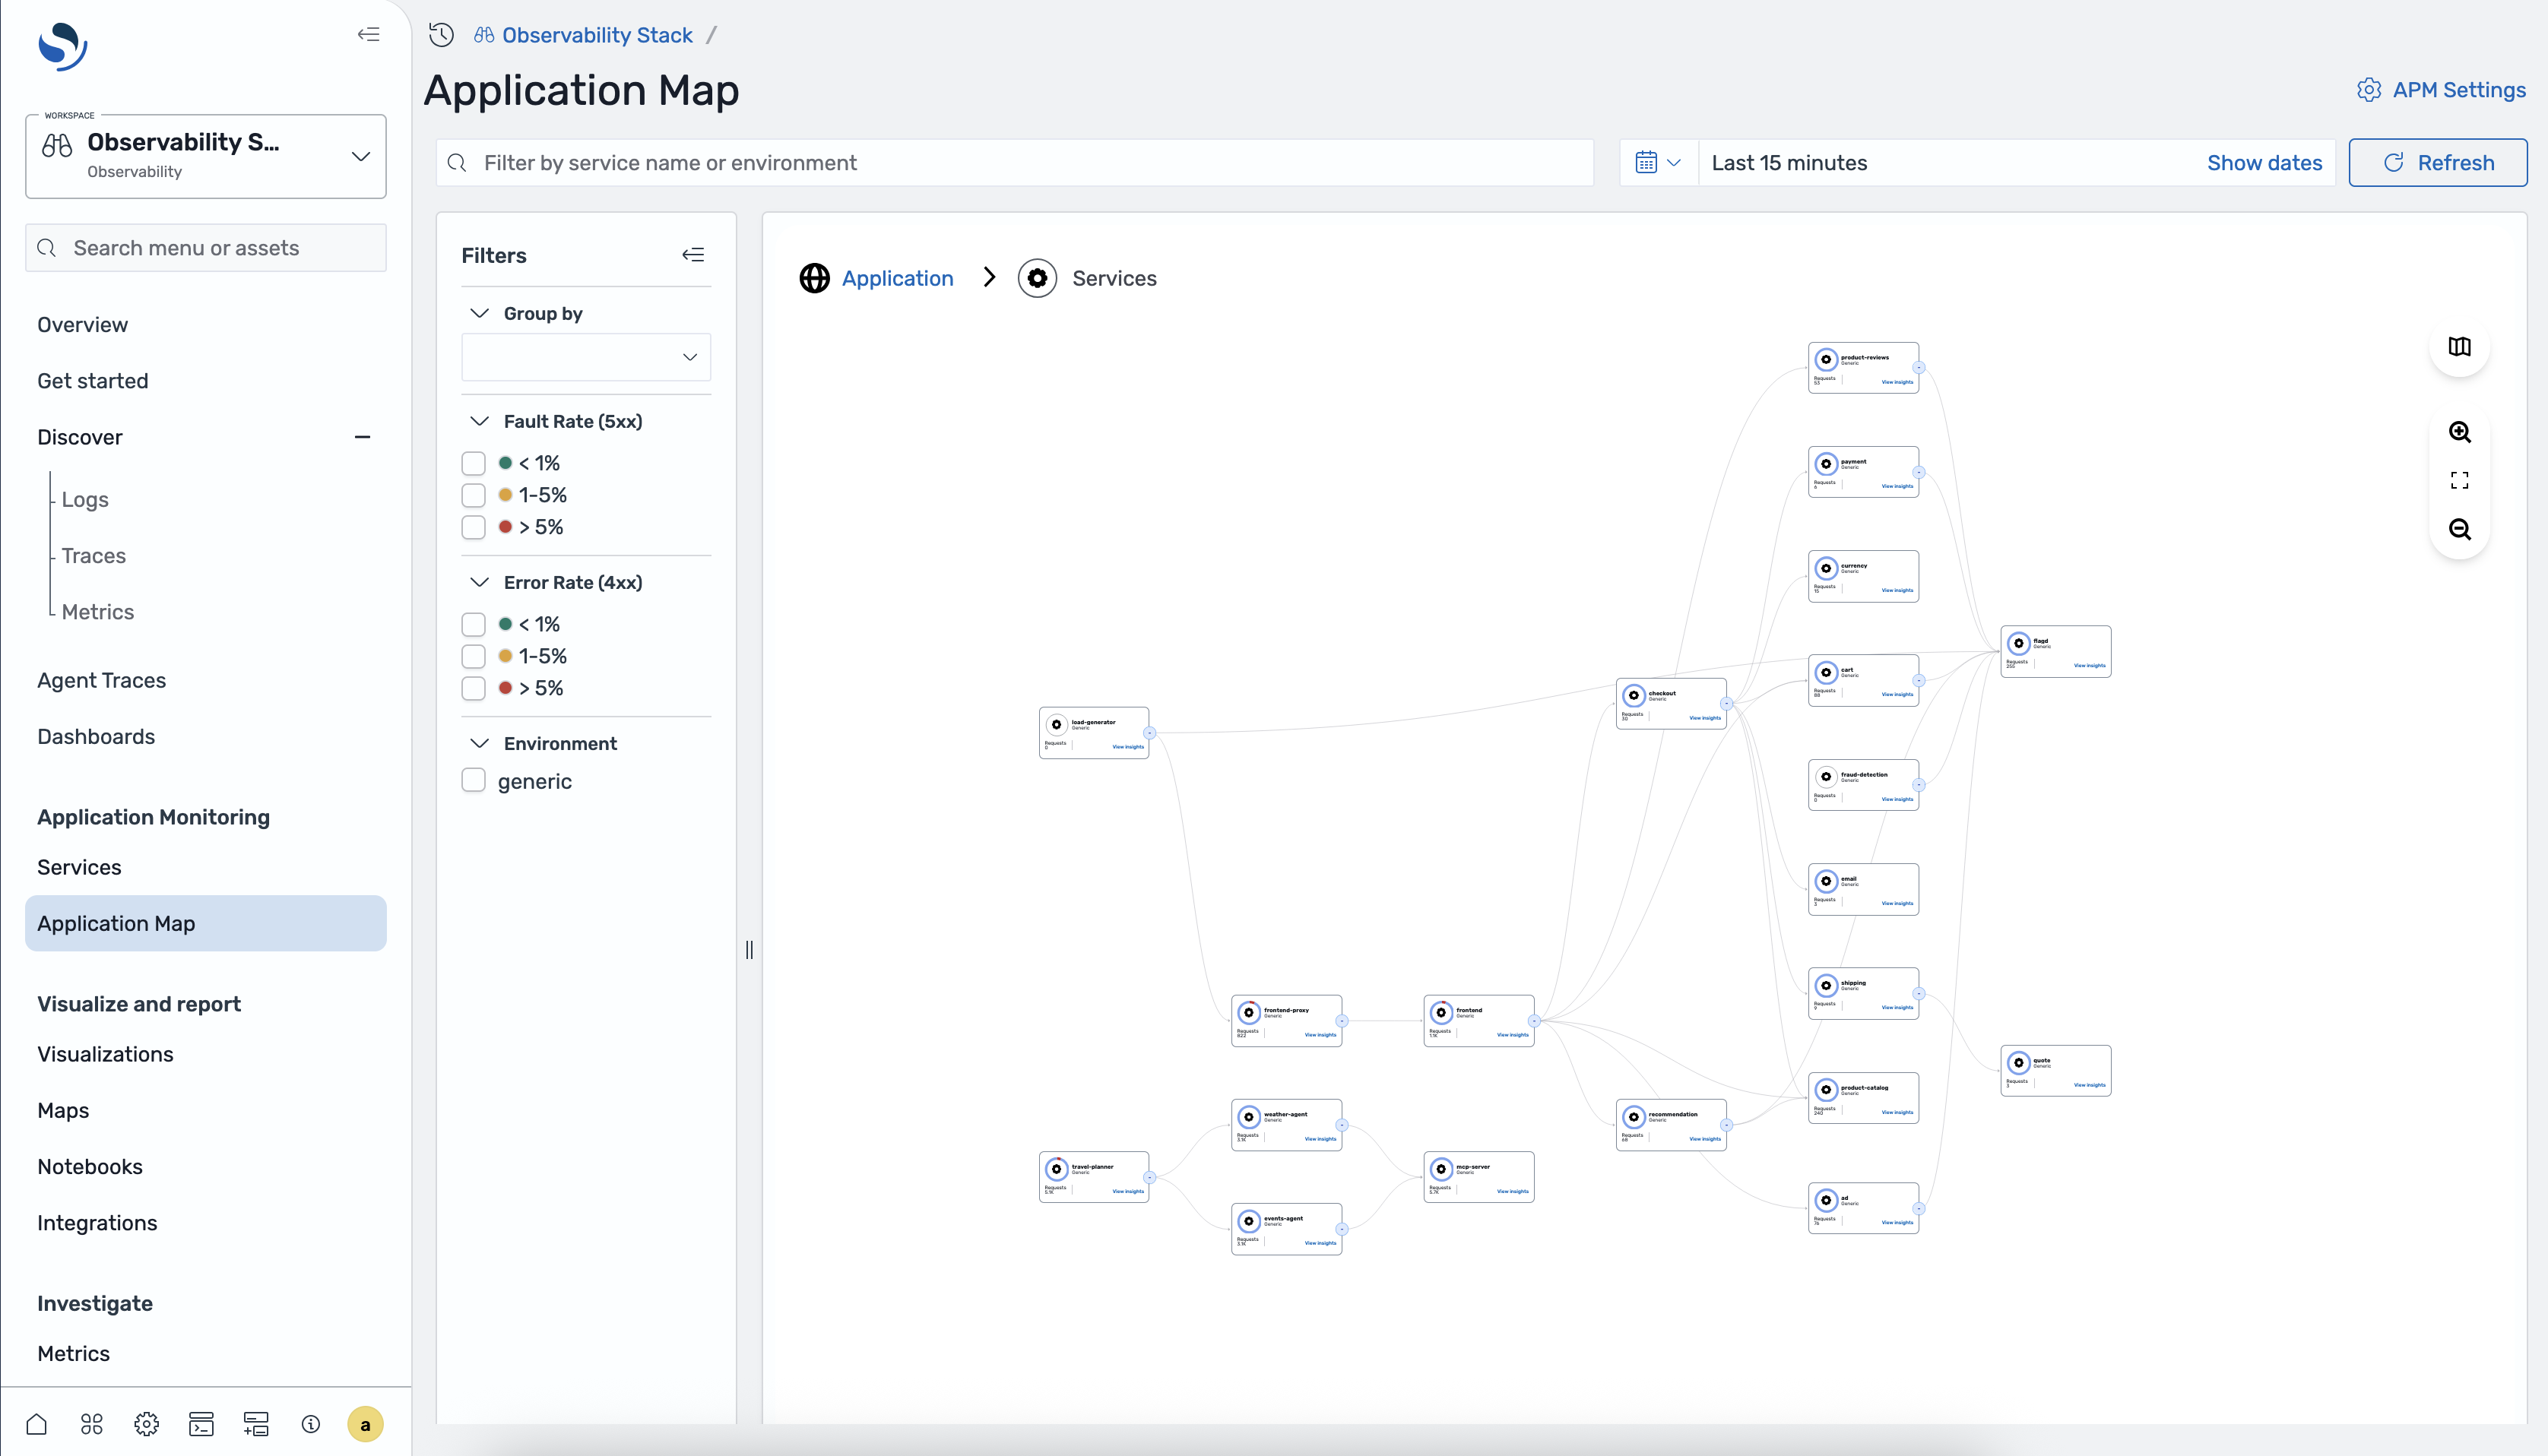
Section titled “2. Explore the service map”- In Application Monitoring, select Application Map.
- Set the time range to include the request you generated.
- Select a service node to view its request, latency, error, and fault metrics.
- Select View details to open the service detail view.
The map is built from propagated trace context. A missing edge usually means a
downstream service did not receive or forward the W3C traceparent header.
3. Read the RED metrics
Section titled “3. Read the RED metrics”For each service, look for:
- Rate: request volume over the selected time range
- Errors: client-side failures, usually HTTP 4xx responses
- Duration: request latency, including percentile charts such as P50, P90, and P99
- Faults: server-side failures, usually HTTP 5xx responses
Use the service detail view to compare operations and downstream dependencies. This helps distinguish a slow service from a slow dependency.
4. Jump from a service to traces and logs
Section titled “4. Jump from a service to traces and logs”- From a service or operation, open the correlation actions.
- Choose View traces to inspect individual spans.
- Choose View logs to inspect log events for the same service and time range.
Log links require a trace dataset and log dataset with a configured correlation. See Correlations if the log action is not available.
5. Create a useful failure signal
Section titled “5. Create a useful failure signal”If you enabled the OpenTelemetry Demo, use its feature flag page to turn on a failure scenario. Return to Application Monitoring and watch the affected service’s fault rate and dependency path change.
This is a quick way to confirm that the stack is receiving new telemetry and that the service map and RED metrics are being updated.
What to do next
Section titled “What to do next”- Application Monitoring - understand the APM components and configuration
- Application Map - learn the map filters and grouping options
- Services - inspect service and operation details
- Troubleshooting APM - diagnose missing traces, services, or metrics