

Sankey chart
A Sankey chart shows weighted flows between two categorical fields. Each unique value becomes a node, and each source-to-target pair becomes a link whose width is proportional to its value. Use it to see how volume is distributed from one dimension to another, for example from clients to operating systems or from services to downstream dependencies.
Creating a Sankey chart
Section titled “Creating a Sankey chart”The following examples build on each other, starting with a basic chart and adding customization.
Basic Sankey chart
Section titled “Basic Sankey chart”Start with an aggregation query that counts events by two categorical fields:
source = logs-otel-v1* | stats count() by `resource.attributes.service.name`, severityTextAfter running this query, select Sankey in the Visualization type dropdown. The fields are mapped as follows:
- The Source displays the
resource.attributes.service.namefield. - The Target displays the
severityTextfield. - The Value displays the
count()field.
The result is a flow diagram with one node per service on the left, one node per severity level on the right, and a link for each combination, as shown in the following image.
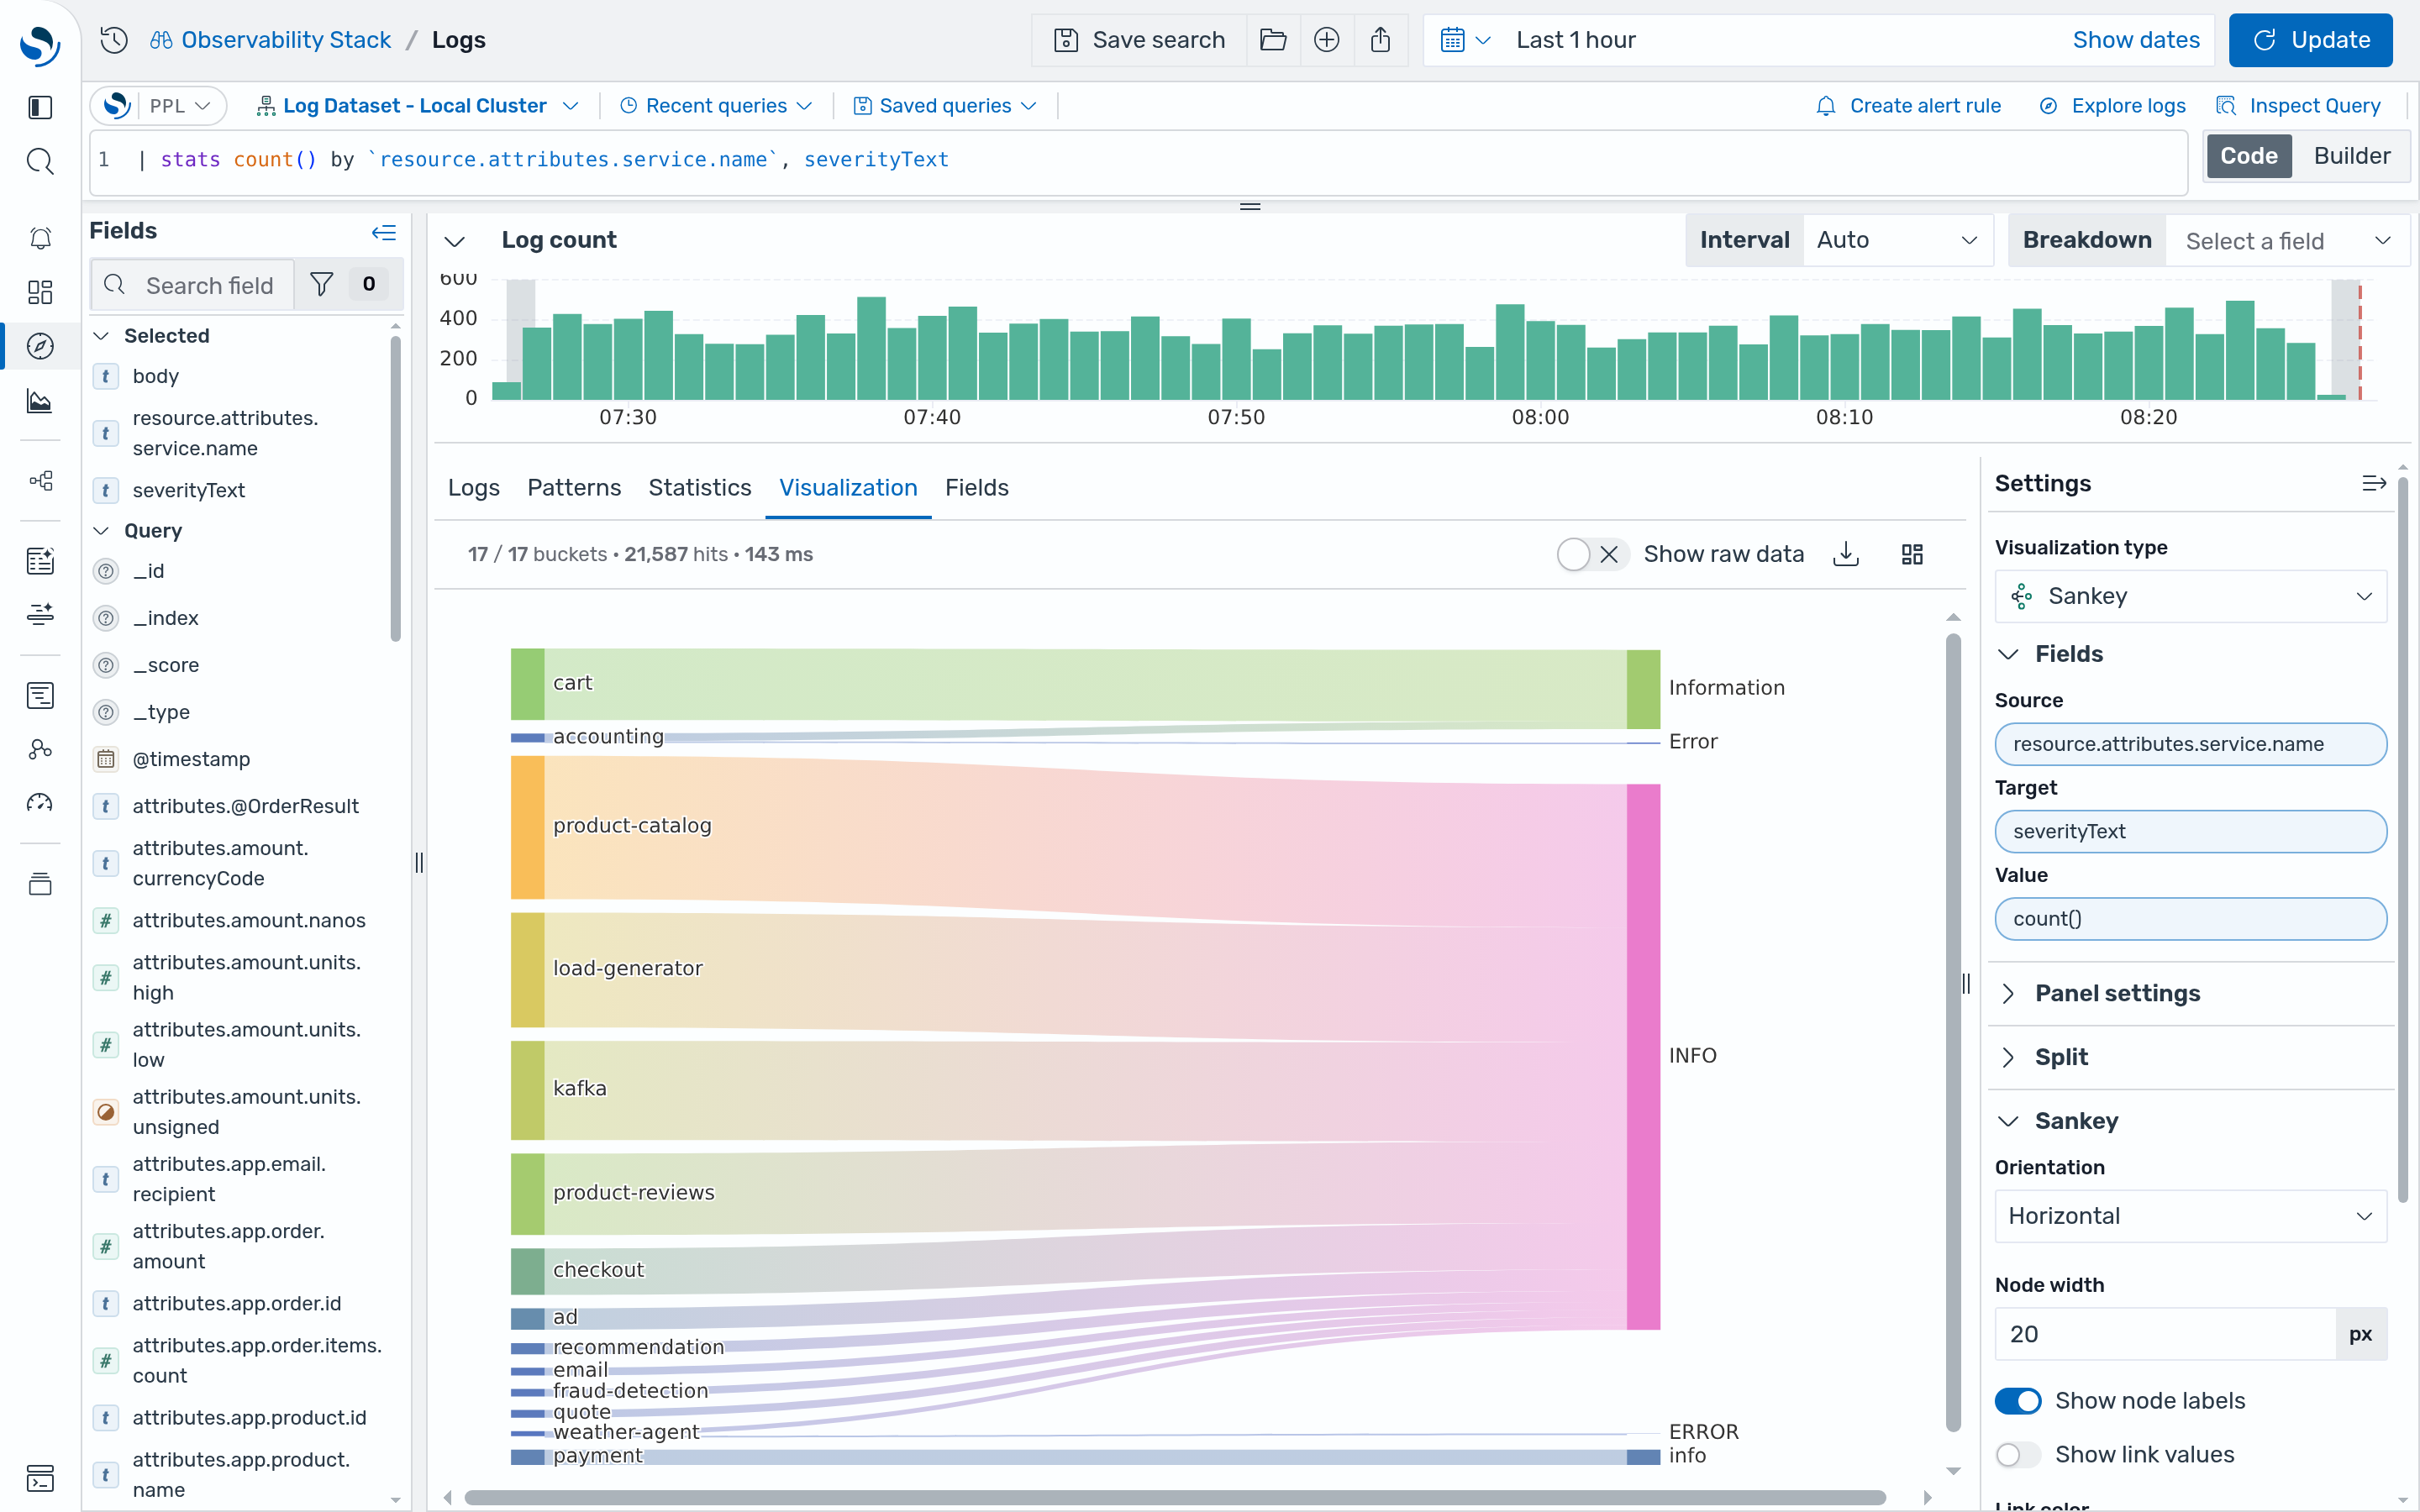
Hover over a link or node to highlight its full path through the chart. You can drag nodes to rearrange the layout.
When building links, the chart combines rows that share the same source and target into a single link by summing their values. Rows are skipped when the source or target is empty, when the source and target are the same value, or when the value is not a positive number.
Customizing the Sankey chart
Section titled “Customizing the Sankey chart”Open the Sankey settings panel and configure the following options:
- Change Link color from Gradient to Source so that each link takes the color of the node it starts from.
- Enable Show link values to display the value of each link on the chart.
- Increase Link opacity to make the links easier to distinguish.
- Select Add level style to color a column of nodes. In the new row, set Level to
1to target the second column (the Target nodes), then choose a Node color and Node opacity.
Configuring a Sankey chart
Section titled “Configuring a Sankey chart”You can configure the following settings in the configuration panel.
Fields
Section titled “Fields”In the Fields section, configure the data fields.
| Field | Description |
|---|---|
| Source | Select a categorical field for the nodes where flows start. Each unique value becomes a node in the first column. |
| Target | Select a categorical field for the nodes where flows end. Each unique value becomes a node in the second column. |
| Value | Select a numeric field that determines the width of each link. For example, COUNT() makes each link proportional to the number of events for that source-target pair. |
In the Split by dropdown list, select a field to split the chart into separate elements by value. For more information, see Split.
Sankey
Section titled “Sankey”The following table describes the Sankey chart settings.
| Setting | Description |
|---|---|
| Orientation | Controls the direction of the flow. Supported values: Horizontal (left to right) and Vertical (top to bottom). Horizontal is the default. |
| Node width | Sets the thickness of each node, in pixels. The default is 20. |
| Show node labels | When enabled, shows the name of each node. Enabled by default. |
| Show link values | When enabled, shows the value of each link on the chart. Values are formatted using the Standard options settings. Disabled by default. |
| Link color | Controls how links are colored. Supported values: Source (color of the source node), Target (color of the target node), and Gradient (blends from the source color to the target color). Gradient is the default. |
| Link opacity | Sets the opacity of links, from 0 to 100. The default is 40. |
| Add level style | Adds a style row that overrides node appearance for one column of nodes. You can add multiple level styles. |
Each level style row contains the following settings. To remove a level style, select the delete icon in its row.
| Setting | Description |
|---|---|
| Level | The column of nodes to style, starting from 0 for the first column. |
| Node color | The color applied to all nodes in the level. When empty, nodes use the default palette. |
| Node opacity | The opacity of nodes in the level, from 0 to 100. The default is 100. |
Standard options
Section titled “Standard options”The following table describes how link values are formatted when Show link values is enabled.
| Setting | Description |
|---|---|
| Units | An optional unit applied to link values. |
| Unit suffix | Text appended after the unit, or a custom unit. |
| Decimals | The number of decimal places to display. Leave empty for automatic precision. |
Tooltip
Section titled “Tooltip”Toggle the Show tooltip selector to enable or disable tooltips.